We use cookies to enhance your browsing experience and analyse our traffic. By clicking “Accept All”, you consent to our use of cookies according to our Cookie Policy. You can change your mind any time by visiting out cookie policy.
The model beats your own average. Against assuming you sit at your personal baseline, error drops 9% on overnight HRV, 18% on daily heart rate, and 28% on workout heart rate.
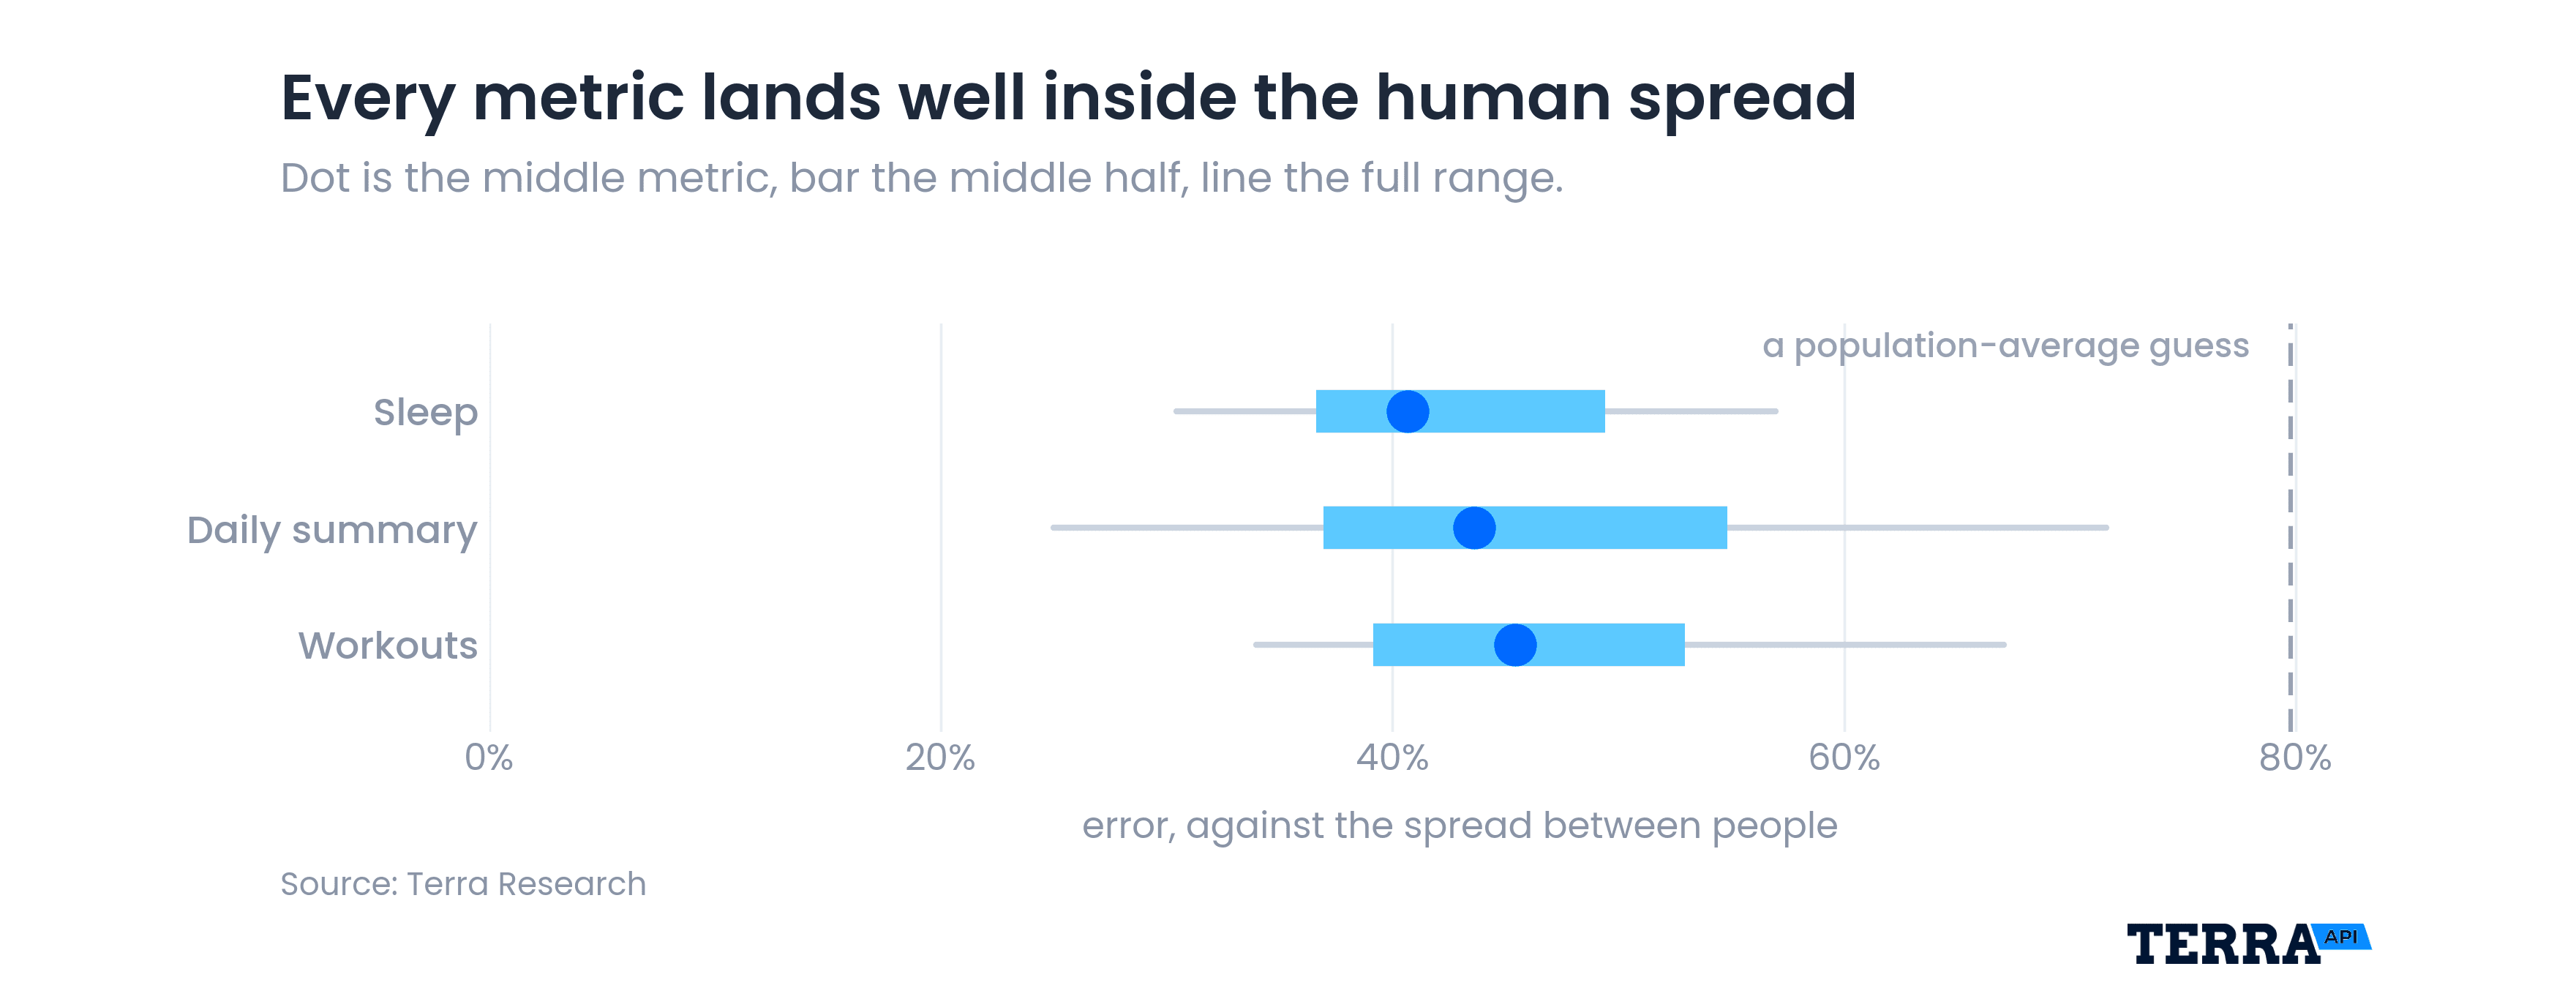
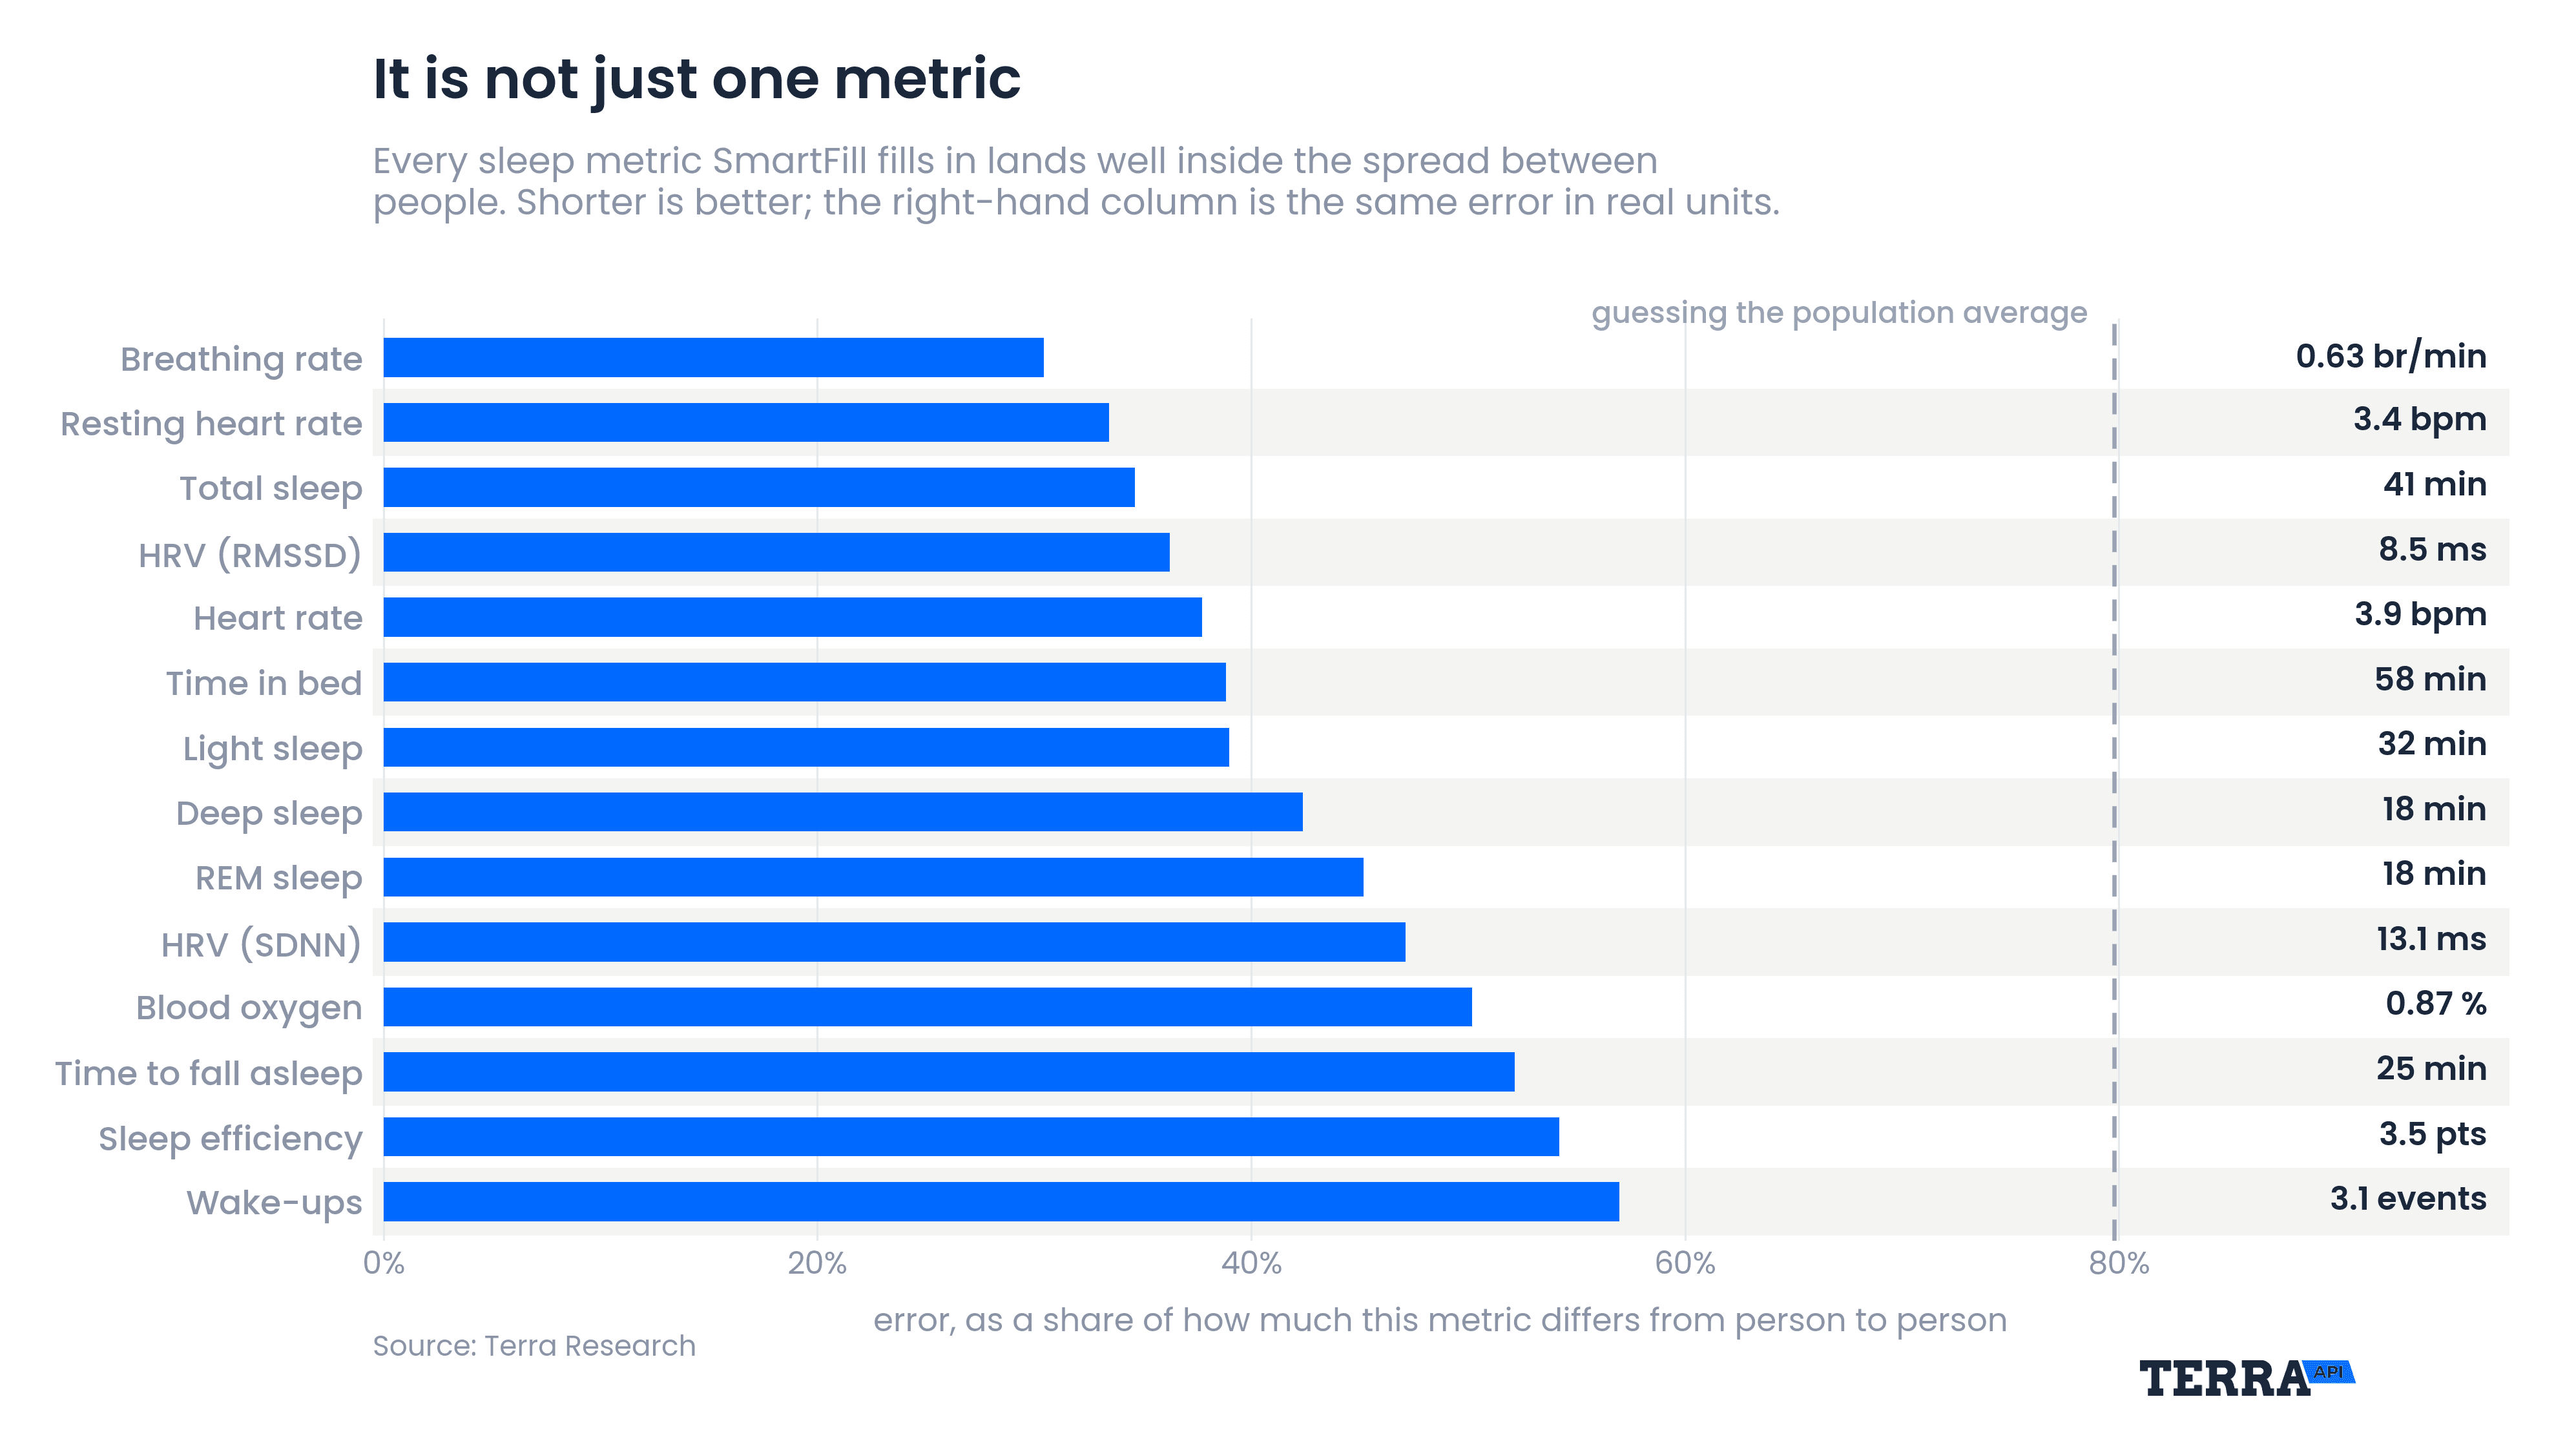
Every filled metric lands inside the human spread. Imputation error is smaller than the natural variation between people, so a filled value is closer to the truth than a population average would be.
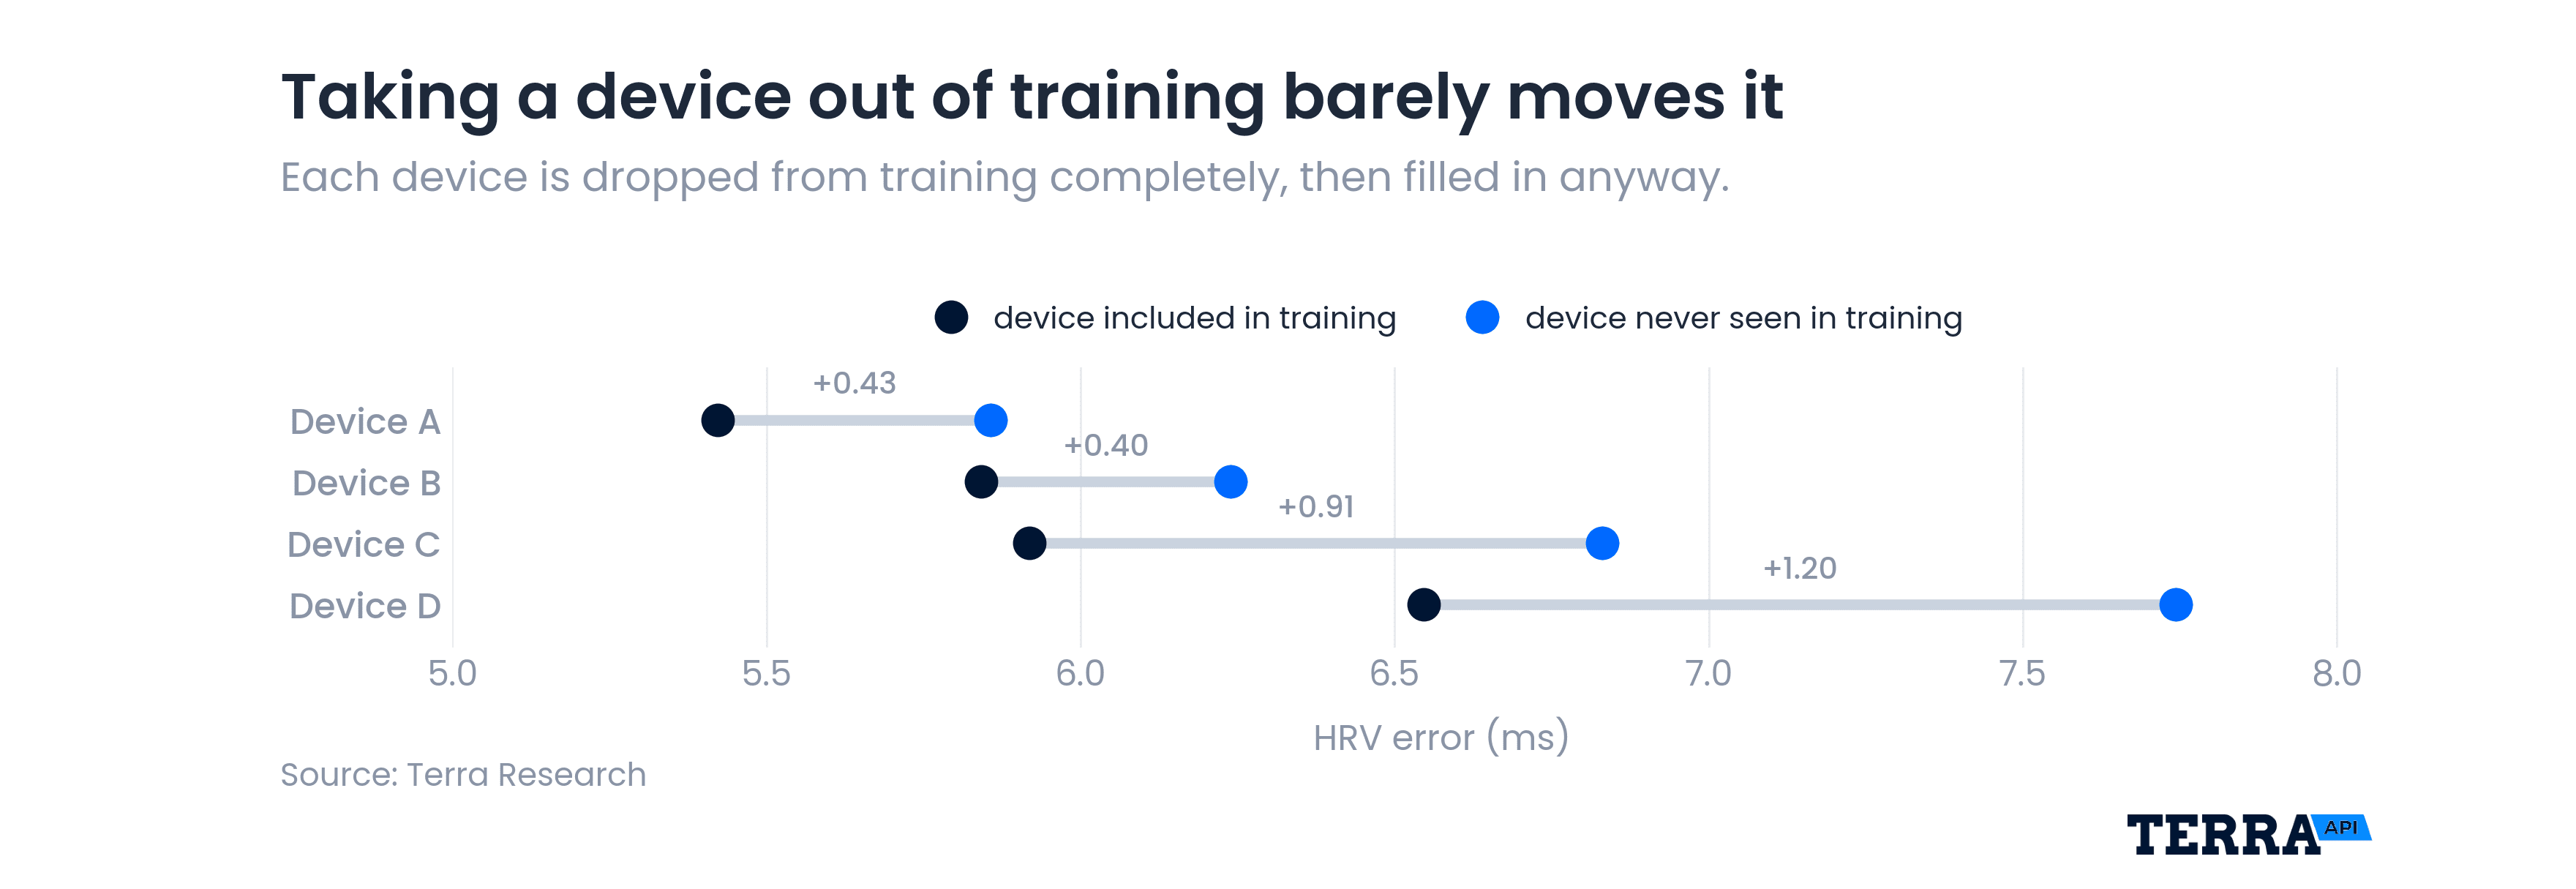
It works on devices it has never seen. Dropping a whole device family from training raises HRV error by at most 1.2 ms, so new integrations don't need to wait for a device-inclusive retrain.
Get the latest Terra Research reports and insights every week as soon as they're published.
Wearable data is a data engineering nightmare. Charge on device, position on body, software settings or cross-API technicalities leads to data being partly or even completely missing. Naturally, this affects every bit of downstream analysis or presentation using this data.
But data doesn’t exist in isolation. Certain values can be derived from others, while some other values almost never move, or move in entirely predictable ways from day-to-day. This led us to ask the question; to what extent can we predict missing health information from information that already exists?
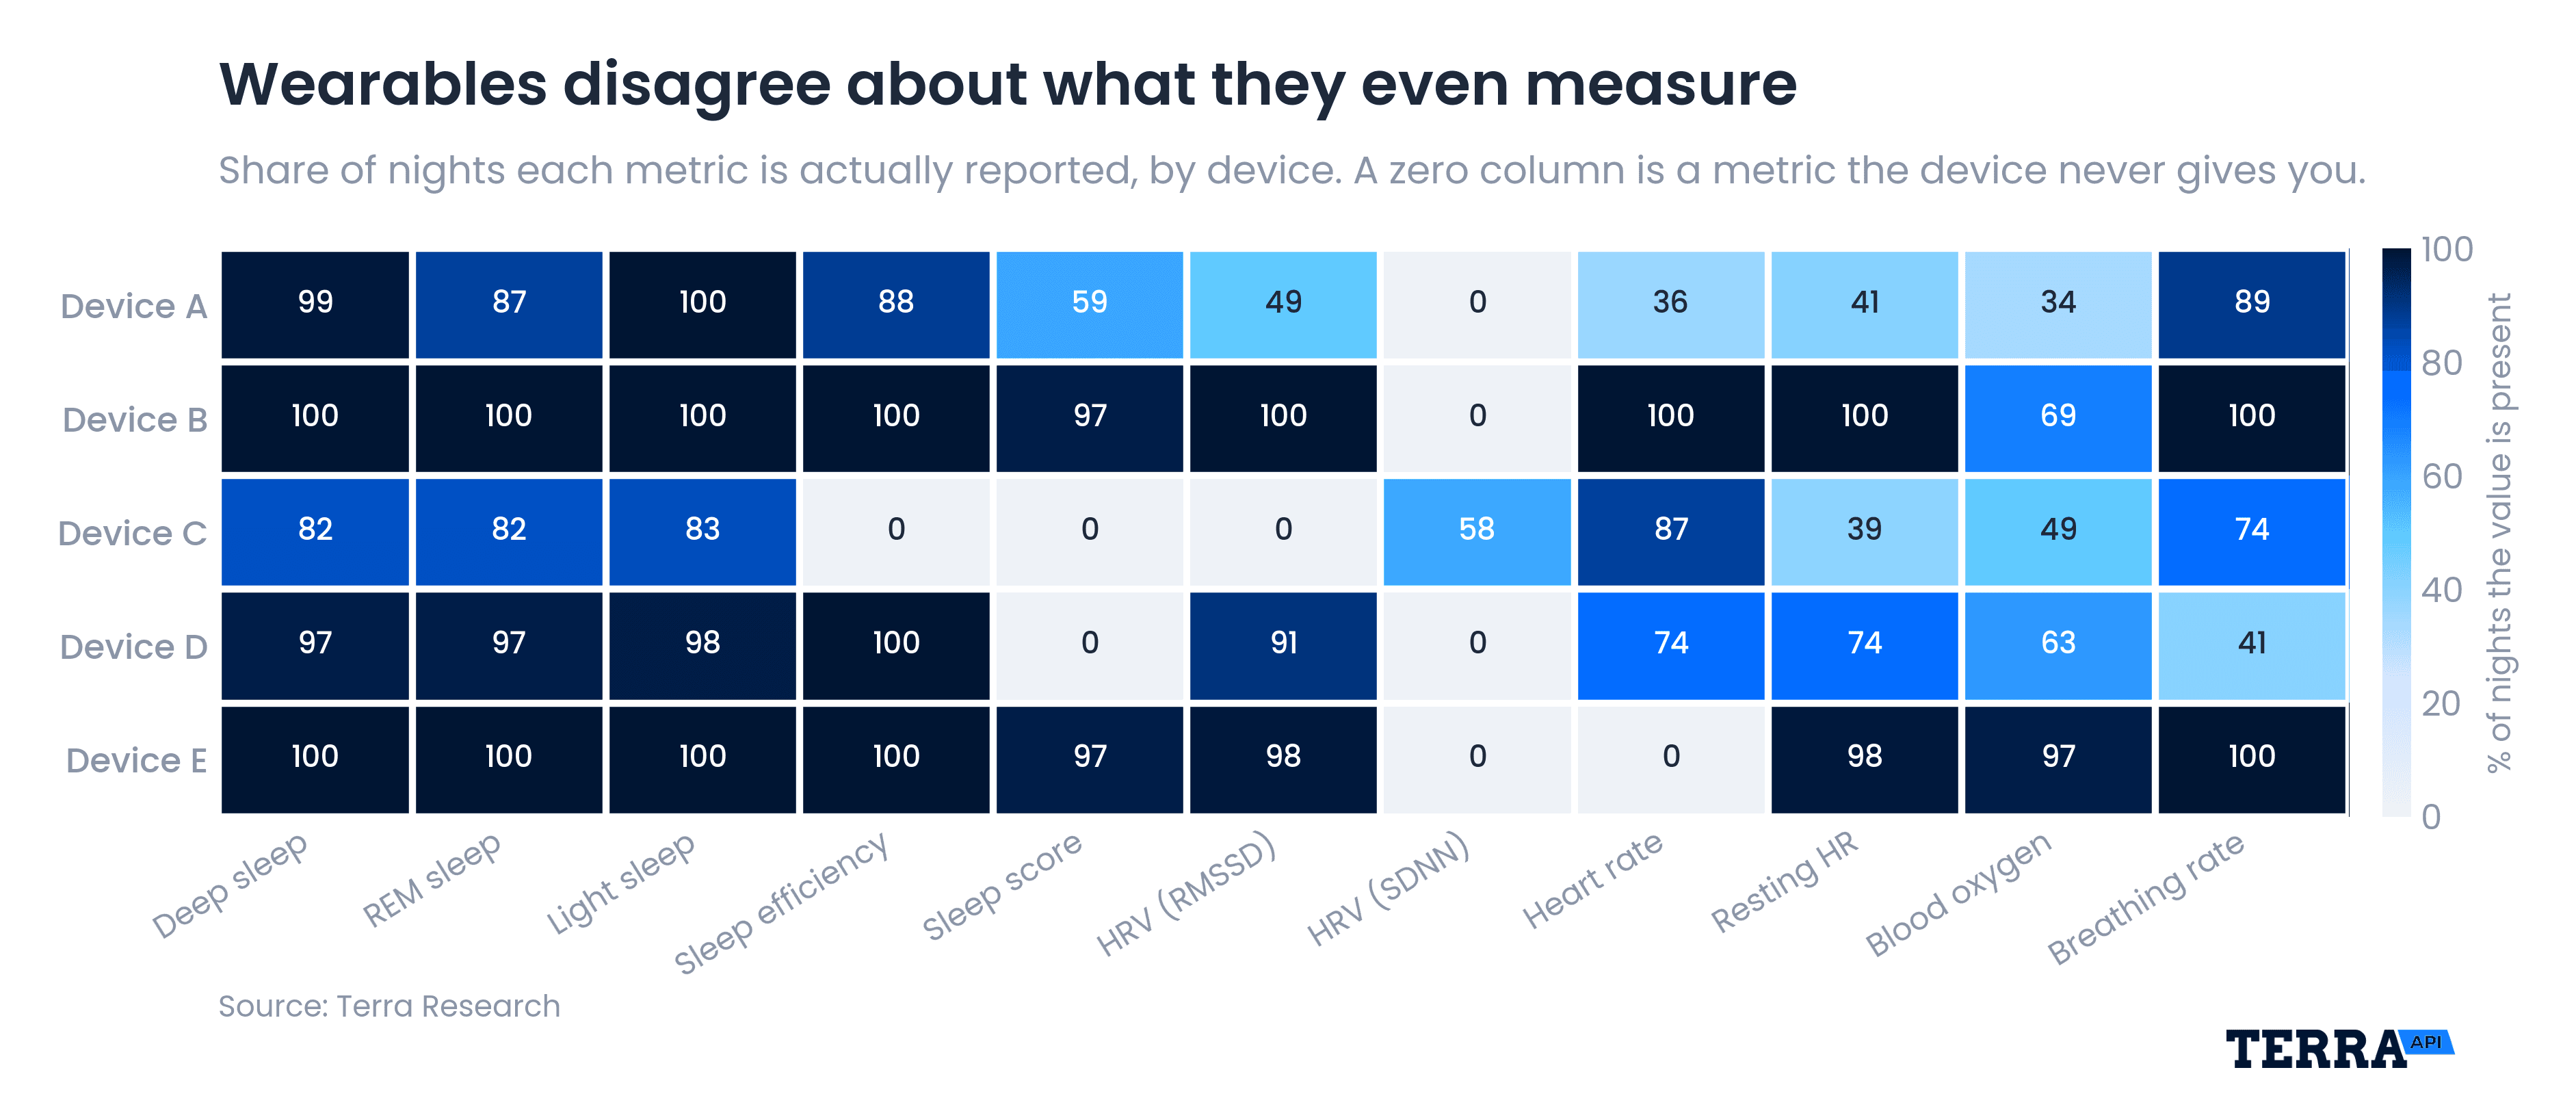
Coverage of health data streams reported by each major wearable device.
At Terra, we’ve noticed that machine learning techniques do extremely well when trying to uncover patterns within high-dimensional data, exactly the kind of data health devices report. How does HR relate to HRV, and how would that relate to the breathing rate at night? ML algorithms do extremely well at this kind of task.
So we decided to build it. A tabular model that fills in health information that a wearable never gave at all. We considered using tabular foundation models but felt our data had very specific tendencies that we wanted to build around.
Much of our inspiration came from a 2020 NeurIPS paper titled 'Handling Missing Data with Graph Representation Learning' that details a framework where tabular data is modeled as a graph, column identities are nodes and the values they hold are edges. Then, a missing value simply becomes an edge regression task.
A couple tweaks to this adding in personalization as well as a method to accommodate seen and unseen devices, and you end up with a model that works fairly well.
How well, you ask? Well. Against the strongest simple alternative, which is assuming you are at your own average, error drops 9% on overnight HRV, 18% on daily heart rate and 28% on workout heart rate. Against a properly tuned classical setup on the same data, 5.91 against 7.08 ms.
Typical missing-data gaps across wearable health data streams.Smart Fill reconstruction error versus per-user average baseline.
It also holds up on devices it was never trained on: drop a whole device family out of training and error rises by at most 1.2 ms of HRV, still matching or beating that person's own average, which never lost access to the device. A new integration does not mean waiting for a device-inclusive retrain.
Missing-data prevalence per wearable brand and metric.
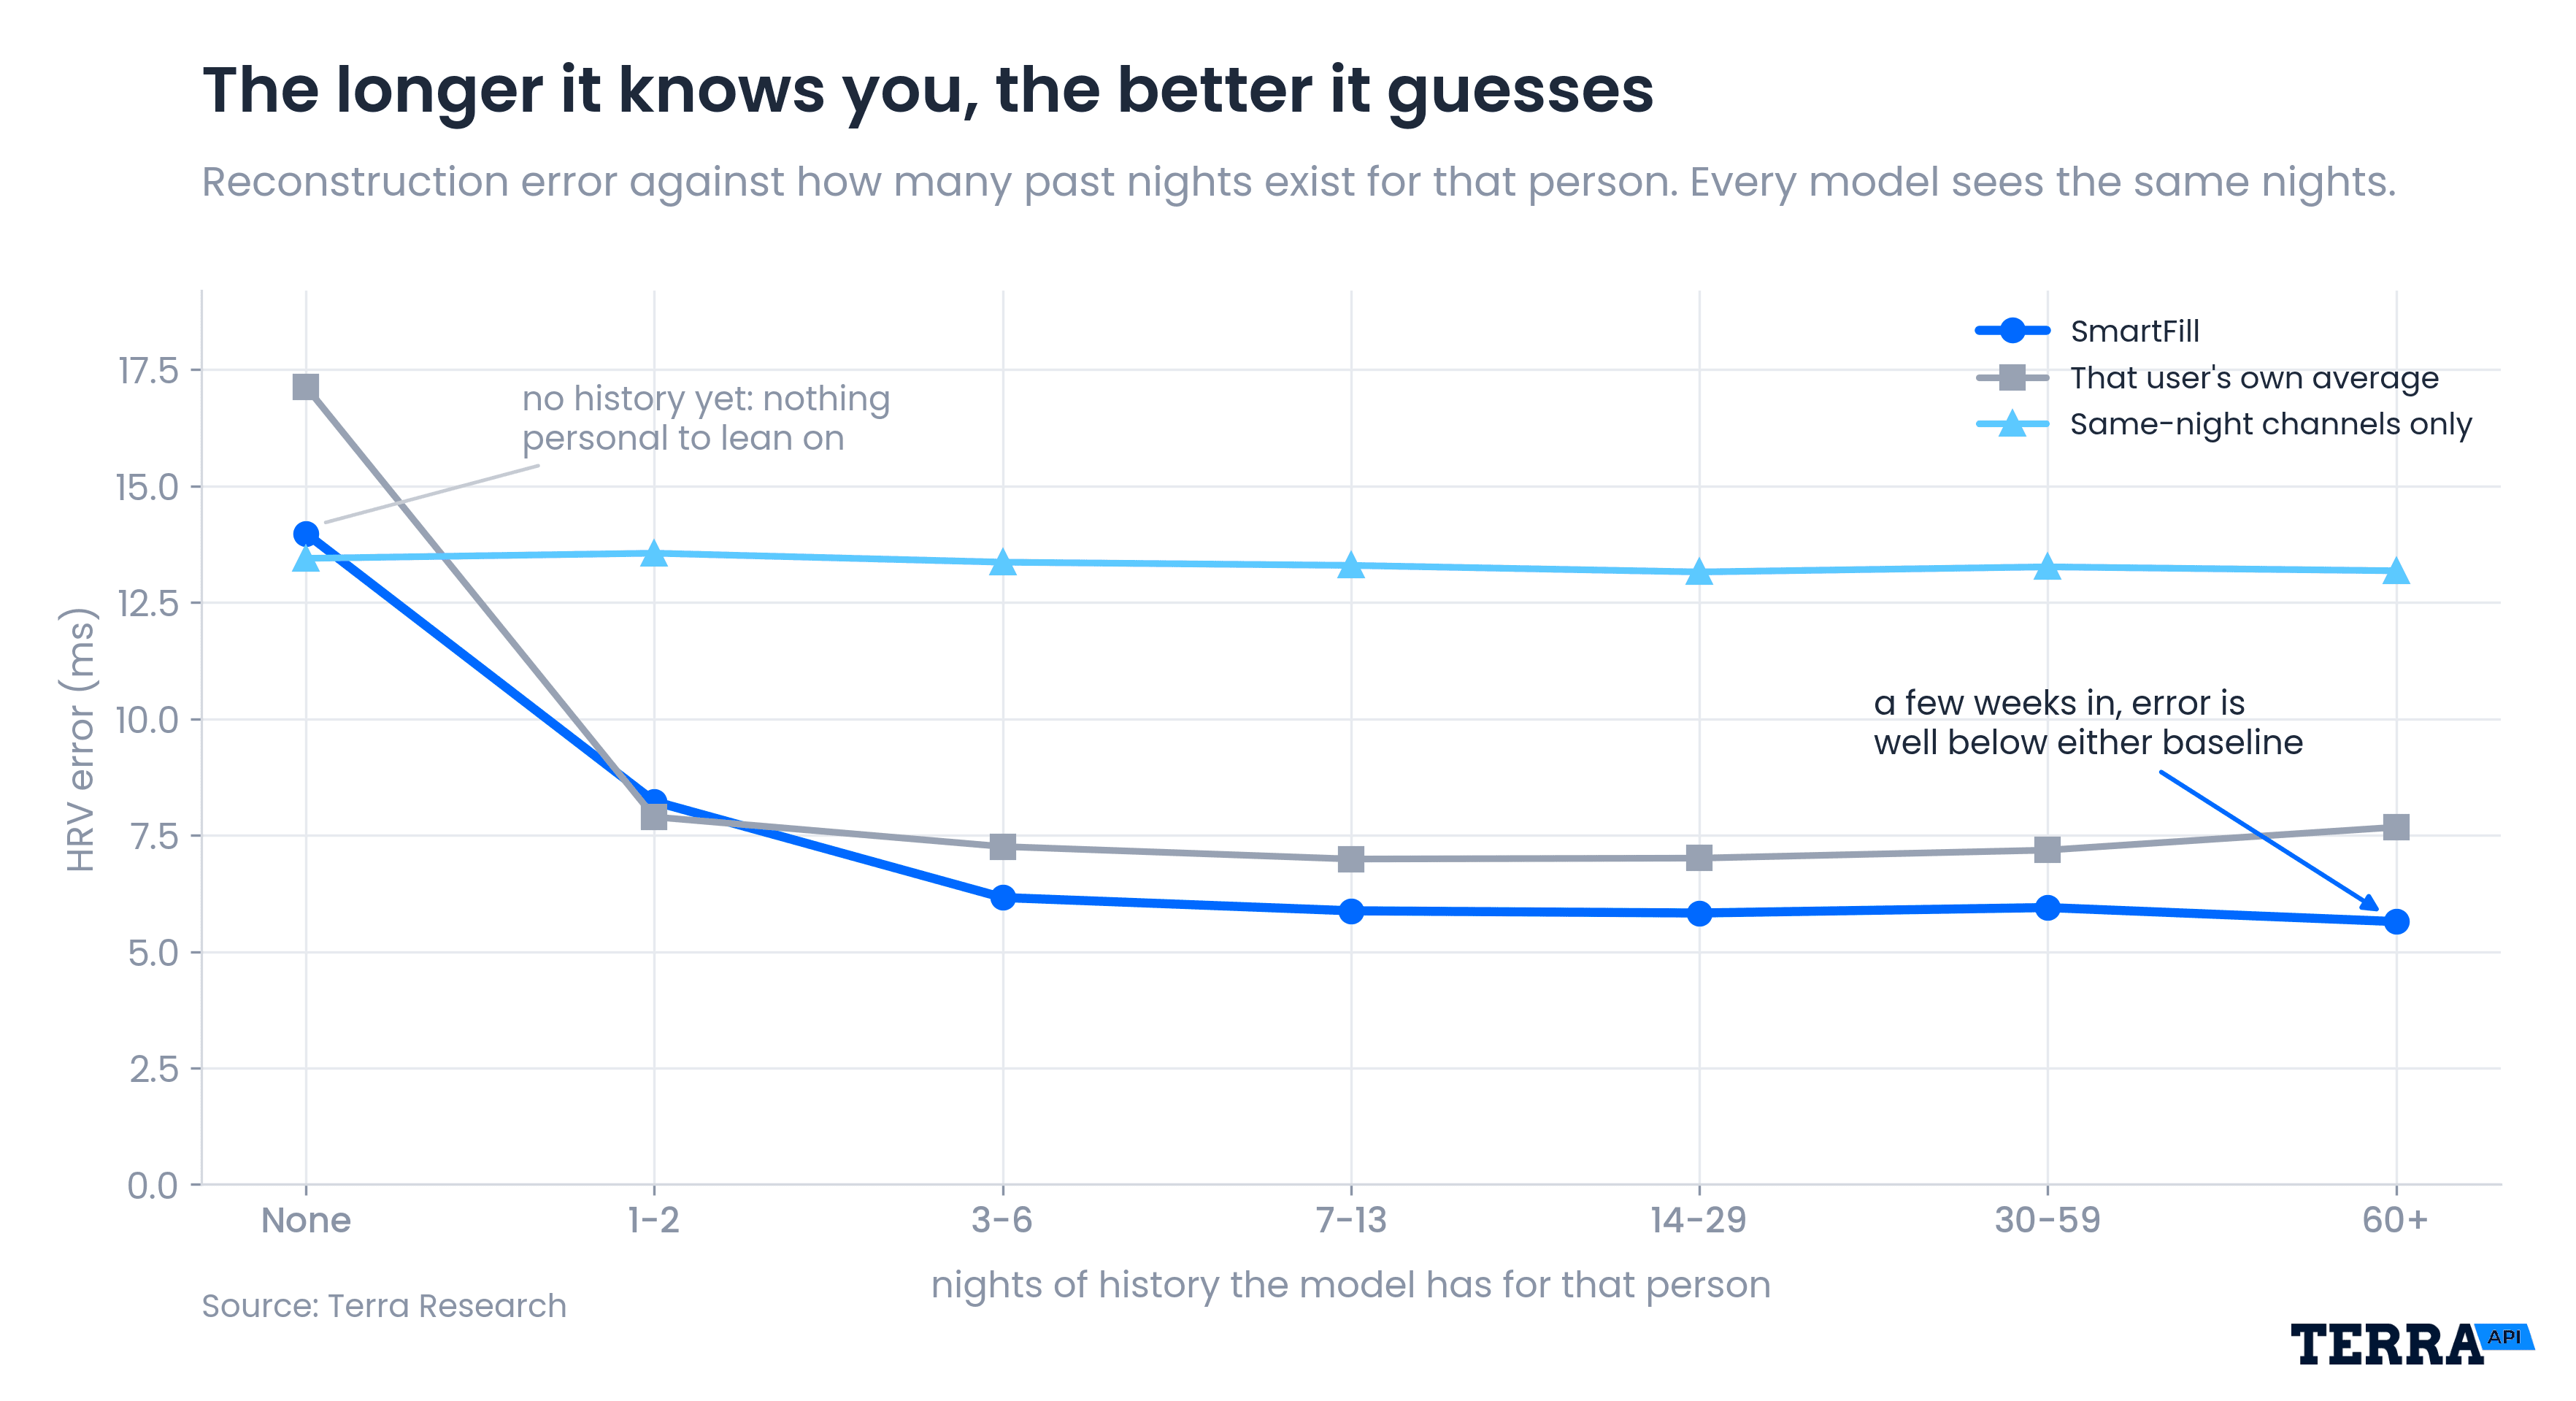
To check how important personalization is to this, we also looked at how error drops as amount of data increases—which showed us that a simple average’s error is somewhat U-shaped, whereas SmartFill error continues to decrease with increased datapoints. Predictions based on no history remained at a constant error.
Historical data depth available by wearable device.
We also checked whether these imputations helped our own ML models’ abilities to predict certain conditions and found an increased accuracy across conditions like sleep-apnea as well as improved representation qualities in more general-purpose models. One of the failures we saw while doing this was that of conditions related to menstruation; it turns out that predicting temperate offsets, the primary signal for menstruation, from surrounding information is a pretty difficult task.
We quantify the uncertainty in every prediction, so the accuracy of anything you choose to use is known rather than assumed. Each filled value comes back with a range, and we report a confidence tier alongside it: high, medium or low. The tier comes from how wide that value's own range turned out to be, compared to the ranges we typically produce for that device. The narrowest third are high confidence, the middle third medium, the widest third low. Values we can derive exactly from others are always high, and a device whose accuracy we have not been able to confirm never reports as high.
None of this makes a filled value a measurement. It is an estimate, it says so, and it comes with a range and a rating so you can decide per value whether to use it, show it, or ignore it. That distinction matters more to us than the error numbers: a model that quietly guesses is worse than a gap, because a gap is at least honest about itself.
What we would rather not do is pretend missingness is an edge case. It is the normal condition of wearable data, and every product built on it is already making an implicit decision about how to handle the holes, usually by dropping the row or carrying the last value forward. SmartFill is our attempt to make that decision explicit, measured, and yours.
SmartFill is live in the Terra dashboard. If you are working around missing data today, we would like to hear which gaps hurt most, because that is what decides where this goes next.
Summary questions
How much missing data is actually normal in wearable feeds?
Missingness isn't an edge case — it's the default condition of wearable data. Charging cycles, body position, software settings, and cross-API quirks routinely leave values partly or completely absent, and every product built on wearables is already making an implicit choice about how to handle those holes (usually by dropping rows or carrying the last value forward). SmartFill's premise is to make that choice explicit and measured rather than hidden.
Can missing wearable metrics really be predicted from surrounding data?
Yes, and meaningfully so. Against the strongest simple baseline — assuming you're at your own average — SmartFill reduces error by 9% on overnight HRV, 18% on daily heart rate, and 28% on workout heart rate. Against a properly tuned classical setup on the same data, HRV error drops from 7.08 ms to 5.91 ms.
How does the model actually work under the hood?
It's inspired by a 2020 NeurIPS paper, 'Handling Missing Data with Graph Representation Learning,' which frames tabular data as a graph — column identities are nodes and their values are edges, so imputing a missing value becomes an edge regression task. Terra extended this with personalization and a mechanism to handle both seen and unseen devices, rather than using a generic tabular foundation model.
Does the model break when I connect a device it's never seen before?
No. When an entire device family is dropped from training, HRV error rises by at most 1.2 ms and still matches or beats that user's own average — which, unlike the model, had full access to the device. That means a new integration doesn't require waiting for a device-inclusive retrain to get useful imputations.
How much does personalization matter for accuracy?
A lot. As user history grows, SmartFill's error keeps decreasing, while a simple personal-average baseline follows a U-shaped curve and eventually degrades. Predictions made with no history stay at a constant error floor — usable, but clearly worse than what personalization unlocks over time.
How do I know whether to trust any individual filled value?
Every prediction ships with a range and a confidence tier: high, medium, or low, assigned by comparing that value's range width against typical ranges for the same device. The narrowest third are high, the middle third medium, the widest third low — values derivable exactly from others are always high, and unverified devices never report high. This lets you decide per value whether to use it, display it, or ignore it.
Do these imputations actually help downstream models, or just fill gaps cosmetically?
They help downstream performance. Feeding SmartFill imputations into Terra's own ML models improved accuracy on conditions like sleep apnea and boosted representation quality in more general-purpose models. The one clear failure was menstruation-related prediction, since temperature offsets — the primary signal — are genuinely hard to reconstruct from surrounding metrics.
Isn't filling in missing health data risky or misleading?
Only if you pretend it's a measurement. SmartFill labels every filled value as an estimate, ships it with a range, and attaches a confidence tier — the philosophy is that a model that quietly guesses is worse than a gap, because a gap is at least honest. The goal is to make the imputation decision explicit and auditable, not to disguise estimates as ground truth.