We use cookies to enhance your browsing experience and analyse our traffic. By clicking “Accept All”, you consent to our use of cookies according to our Cookie Policy. You can change your mind any time by visiting out cookie policy.
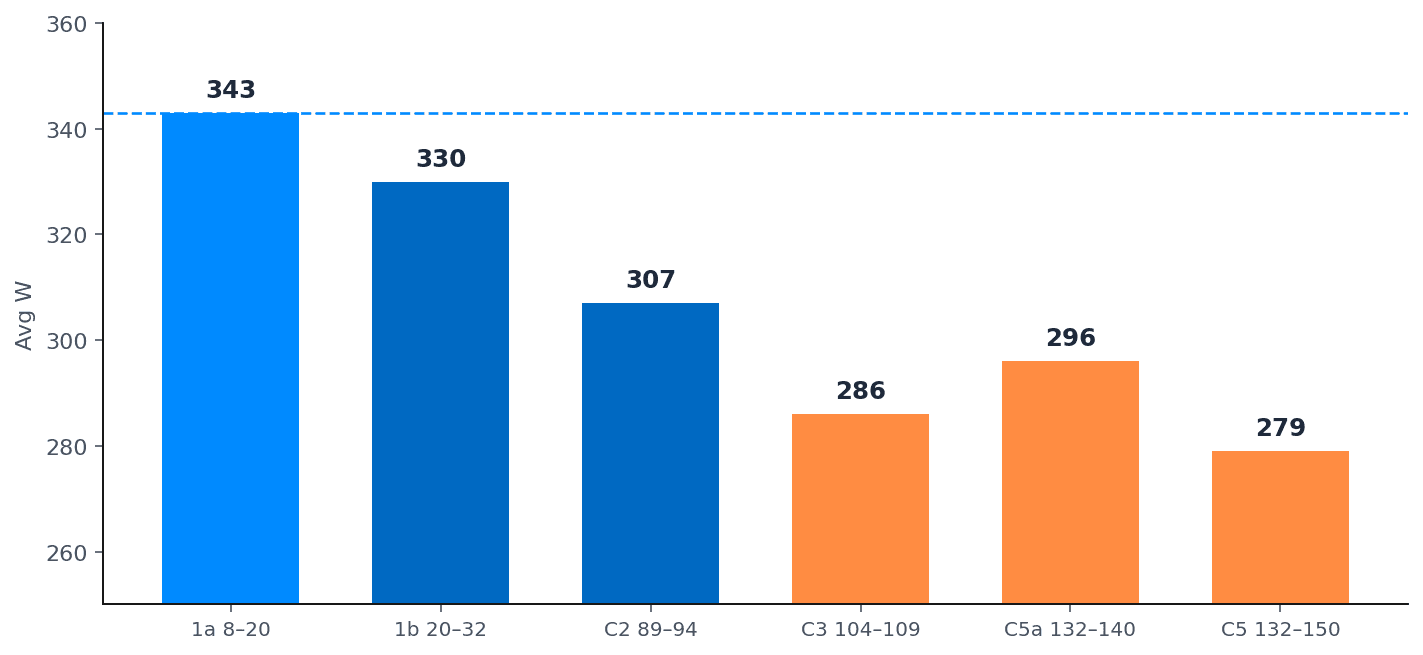
The first climb cost 10 to 15% of power for the rest of the ride. The opening 1,200 m ascent averaged 343 W. Later climbs at similar grades sat at 286 to 307 W, and the drop never came back.
Climb rate barely moved even as pace fell apart. Pace went from 4:15/km on the flat to 11:51/km on the off-road summit block, but vertical ascent rate held between roughly 716 and 766 m/h across every climbing segment.
Nearly ten hours at a near-identical heart rate. Average HR was 132 on the bike and 130 on the run, with 275 W average and 300 W normalized across 179 km and 3,000 m of ascent.
What it Takes to Come Second in The Worlds Hardest Triathlon - The Data
On Saturday, I finished the Norseman Extreme Triathlon, often billed as the toughest Triathlon in the world. The 3.8 km swim, 180km bike, and 42.2 km run took me just over ten hours eighteen minutes from swim start to the summit of Gaustatoppen mountain. It was a real “bucket list” event for me, so I was excited and nervous about it in equal measure.
The swim is in the stunning Eidfjord, the bike ride takes you mostly west across Norway, and various mountain plateaus with ever-changing weather, and the run starts flat and then climbs relentlessly from 25km.
Is it the toughest Triathlon in the world? Well, that depends. Was it very tough? Certainly. The day itself felt messy, challenging, and, once you dig into the files, more coherent than it felt at the time.
I came second in 10:18:19. Kristian Grue defended his title in 9:53:46, nearly twenty-five minutes clear, and was in a league of his own. Third place went to Hans Christian Tungesvik, only 36 seconds behind me. I could see him and his team catching me quickly from below in the last kilometer and had to speed up!
I recorded the whole race on a COROS in triathlon mode, and the bike on a Wahoo. The transition times in the files are wrong. I didn’t stop and start the COROS cleanly going in and out of T1 and T2, so those flashes of “instant transitions” are unfortunately not ninja changing!
The weather was probably ideal, not too hot, not too cold, and a slight tailwind for much of the bike.
Get the latest Terra Research reports and insights every week as soon as they're published.
I actually really enjoyed the swim. Three point eight kilometers in Eidfjord, about an hour, roughly 1:35/100 m. The distance looks accurate, but the swim itself still felt slow, which could have been due to the current. Water temperature felt like 15–16°C to me and was comfortable.
I did the whole thing on my own, at my own pace. I desperately wanted to hang onto the feet in front of me, but I’ve previously been reminded of the limits of my swim fitness. With limited training, I can still start hard for three to five minutes and then blow up. So I didn’t.
I’m discarding the swim heart-rate file entirely. I’m not sure what was going on, because I was wearing a strap, but the HR on file is wrong.
Bike: A bit of an Optimistic Start
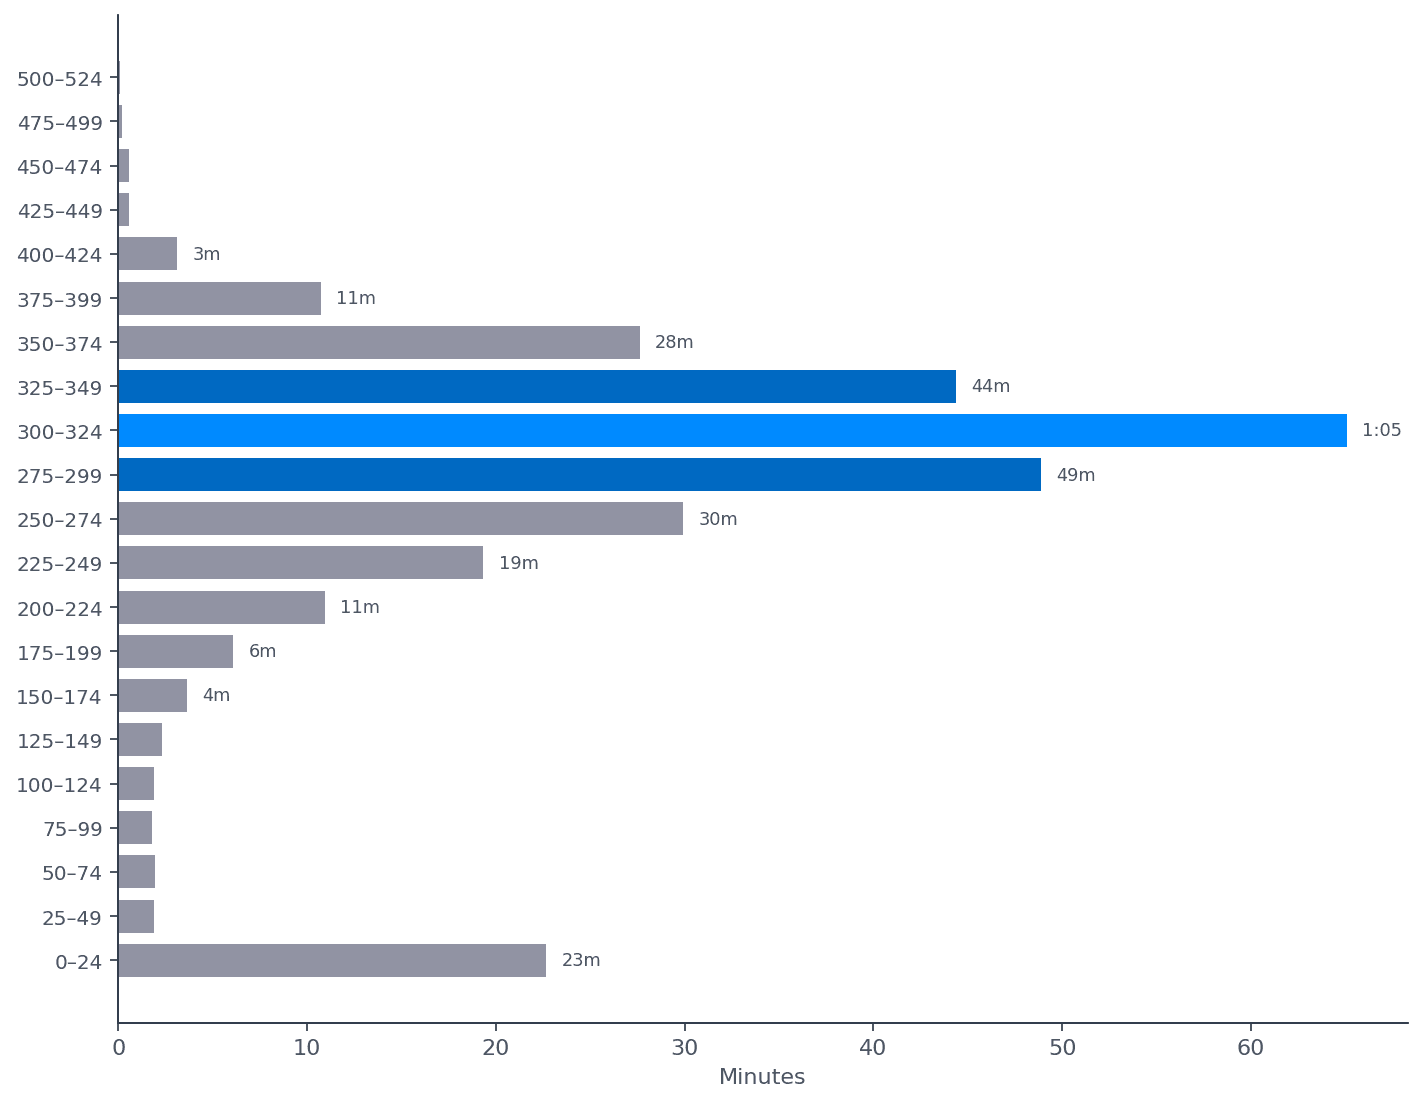
Figure 1: Time in 25 W zones. How long I spent in each 25 W bin. The band 275–349 W is most of the ride; quite a bit of time freewheeling down descents (0–24 W); almost nothing above 375 W.
The Bike: about 179 km, average speed just under 34 km/h, over three thousand meters of ascent, average power 275 W, normalized 300 W, average HR 132, median cadence 85.
Out of T1 I thought I could get away with a fairly hard start. That first climb is an awesome 1200m ascent up a valley, through rock tunnels and past misty waterfalls.
The numbers are blunt about this error of judgement. The steepest early block, roughly kilometers 10 to 15, nine-ish per cent, sat around 354 W normalized. Later climbs of similar character were closer to 285–300 W. A fifteen per cent drop. I definitely paid for this exuberance, and I had to purposely go easy for a section in the middle of the bike.
Figure 2: Climb power (first vs later) Average watts on sustained bike climbs. Left bars are the opening fjord climb (1a/1b); right bars are later climbs. Dashed line marks my first-climb level (~343 W). Later similar grades sit ~286–307 W, about 10–15% lower.
What surprised me is how okay the later climbs still were. I mostly pushed between 275 and 349 watts, with the biggest bin at 300–324 W for over an hour.
Compared with two-plus years ago, I’m maybe five per cent off on power for this type of effort (but much more “sensitive” to high-intensity efforts), amazing given zero structured sessions. But I’m also five-plus per cent heavier, without the old fatigue resistance.
Run: Dying on Zombie Hill, or Not?
Full run: about 42 km in just under four hours, overall 5:44/km, average HR 130, median cadence ~80 (≈160 steps/min). Almost no climbing until the mountain; then ~1,800 m of ascent to a 1,831 m finish.
The marathon was two very different segments. For 25 km it’s mostly very flat on a road along the shores of a stunning lake.
Then you hit Zombie Hill, and it felt like I was slowly dying. I ran most of it, with some short segments of walking to eat and drink. If you look at horizontal pace, it looks shocking, but amazingly vertically almost nothing changed.
On the flat (first 25 km) I averaged 4:15/km. Zombie Hill (roughly km 25–34) slowed that to 6:43/km while gaining about 800 m. From 34–37 it’s still uphill but rolling, and the pace came back a bit to 5:21/km. Then the last off-road block to the summit (~km 37–42) went to 11:51/km.
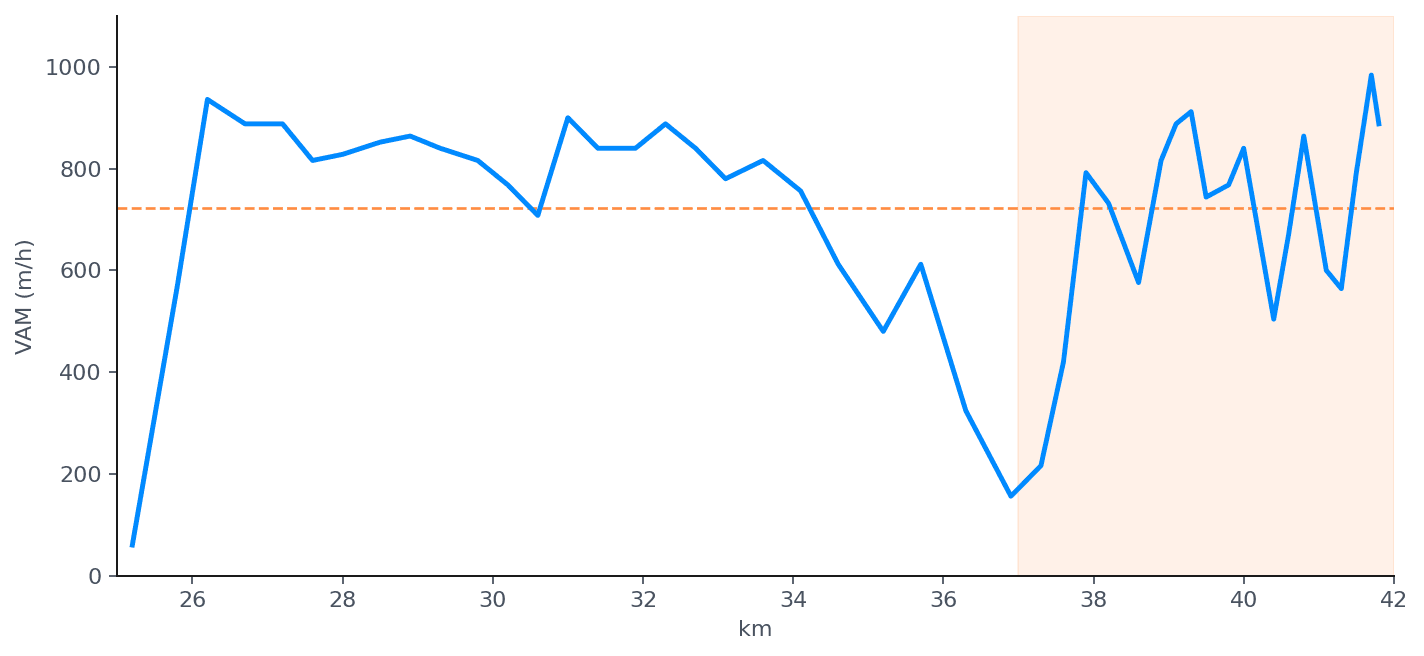
Vertical ascent rate (or VAM, meters climbed per hour) averaged about 726 m/h on the road climb (kilometers 25–37) and about 716 m/h on the off-road summit block. A one per cent difference. Even the final grind to 1,831 m, when I was hiking more than running, still put my VAM at roughly 766 m/h. I would never have guessed I was ascending so consistently!
Figure 3: Run-climb VAM: meters climbed per hour on a rolling 5-minute window from ~km 25 to the summit. Dashed line ≈ climb average (~722 m/h). Shaded area = off-road summit block (~km 37+). The big dip from 34- 37 km was a flatter section.
What I Take Away
This is purposely a data-focused post, and I will write about the psychological elements and fueling strategy later.
Norseman rewards the version of fitness that survives the second half of a very long day, and a mental flexibility to cope with the conditions. It’s a triathlon and an adventure, both mentally and physically. I still have enough of the old engine to get through these things, and my residual exercise is doing enough to help, which is perfect.
Summary questions
How hard is the Norseman Extreme Triathlon really?
Hard enough that my second-place finish took 10:18:19 — a 3.8 km swim in ~15-16°C fjord water, a 179 km bike with over 3,000 m of ascent, and a marathon that climbs 1,800 m to a 1,831 m summit. Winner Kristian Grue finished in 9:53:46, and third place was only 36 seconds behind me. The event rewards fitness that survives the second half of a very long day, not raw speed.
Did going out too hard on the bike actually cost me?
Yes, and the power file is blunt about it. The first steep climb (km 10-15, ~9% grade) sat at 354 W normalized, while later climbs of similar character were 285-307 W — roughly a 15% drop. I had to purposely soft-pedal a middle section to recover, so the early exuberance directly cost pacing efficiency later.
Can I still perform at a high level without structured training?
Surprisingly, yes — within limits. Compared to two-plus years ago I'm only about 5% off my sustained climbing power despite zero structured sessions, though I'm also 5%+ heavier and much more sensitive to high-intensity spikes. Residual fitness plus event-day discipline carried a second-place finish, but the old fatigue resistance is gone.
Why did I 'blow up' on Zombie Hill if my vertical rate stayed constant?
Because horizontal pace is misleading on steep terrain. My pace collapsed from 4:15/km on the flat first 25 km to 6:43/km on Zombie Hill and 11:51/km on the final off-road block — but VAM (vertical ascent rate) held remarkably steady: 726 m/h on the road climb, 716 m/h off-road, and 766 m/h on the final hiking grind. The engine was doing consistent work; only the horizontal component changed.
How should I pace the bike leg of an ultra-triathlon?
Flatter than feels right early on. My time-in-power distribution shows the sweet spot was 275-349 W, with over an hour spent at 300-324 W and almost nothing above 375 W — average 275 W, normalized 300 W across 179 km. Spiking to 354 W on the opening climb bought nothing and cost a forced easy block later.
Can wearable data reconstruct a race better than memory?
Absolutely. The day felt messy and incoherent in the moment, but the COROS and Wahoo files revealed a much more consistent effort — steady 275-300 W bike pacing, VAM within 1% across wildly different terrain on the run. The subjective experience of 'dying' on Zombie Hill wasn't matched by the data, which showed vertical output holding firm.
Is heart-rate data always reliable during a race?
No — I discarded my entire swim HR file. Despite wearing a chest strap, the recorded values were clearly wrong, which is common in cold open water where strap contact and signal transmission struggle. Bike and run HR looked clean (average 132 on the bike, 130 on the run), but wearable data always needs a sanity check before you draw conclusions.
What actually matters for finishing an event like Norseman?
Durability and mental flexibility over peak power. Average bike power of 275 W and run pace of 5:44/km aren't extreme numbers in isolation — what mattered was sustaining them across 10+ hours with 4,800+ m of total ascent and changing mountain weather. The version of fitness that survives hour eight is more valuable than the one that wins the first climb.