- Londoners swapped tubes for tires — April 2026 TFL strikes tripled cycling activity compared to previous weeks' commuting averages. When the trains stopped, the pedals started.
- The strike minted brand-new cyclists — 19% of riders during the strike hadn't logged a single session in the previous 6 weeks. A transport crisis pulled fresh users onto bikes almost overnight.
- E-bikes quietly stole the show — commuter e-bike rides jumped 13% during the strike period. When distance and speed matter more than usual, the motor wins.
London Data
Tube Strikes Made Londoners Active
During the April 2026 Tube strikes, Londoners adapted by cycling more—activity tripled, e-bike commutes rose 13%, and 19% of cyclists were entirely new to riding. Data analysis of 1,566 weekday rides revealed e-bike share jumped from 54.9% to 67.5%, with commutes often staying local. The strikes disrupted transit but highlighted Londoners' resilience in finding alternative ways to move.
Rocio Mexia DiazAI and Health Researcher
April 24, 2026
Key takeaways
“London faces significant disruption on all lines as TfL strikes this April 21 to 24.”
Every Londoner knows the feeling, jam-packed trains, delays or simply no trains. Everyone re-plans how they are going to get across the city and there is one mode of transport that saves the day every time: cycling.
To see what actually changed during the April 2026 strike period, we looked at cycling activity across the strike days and compared it with the previous three weeks. The takeaway: cycling increased and e-bikes take a noticeably bigger share of the load.
More people cycled during the strike
Cycling activities roughly tripled during the April strike compared to the previous three weeks. The drop in activities this Friday is likely a combination of the strikes is coming to an end and the data being analyzed up until noon.
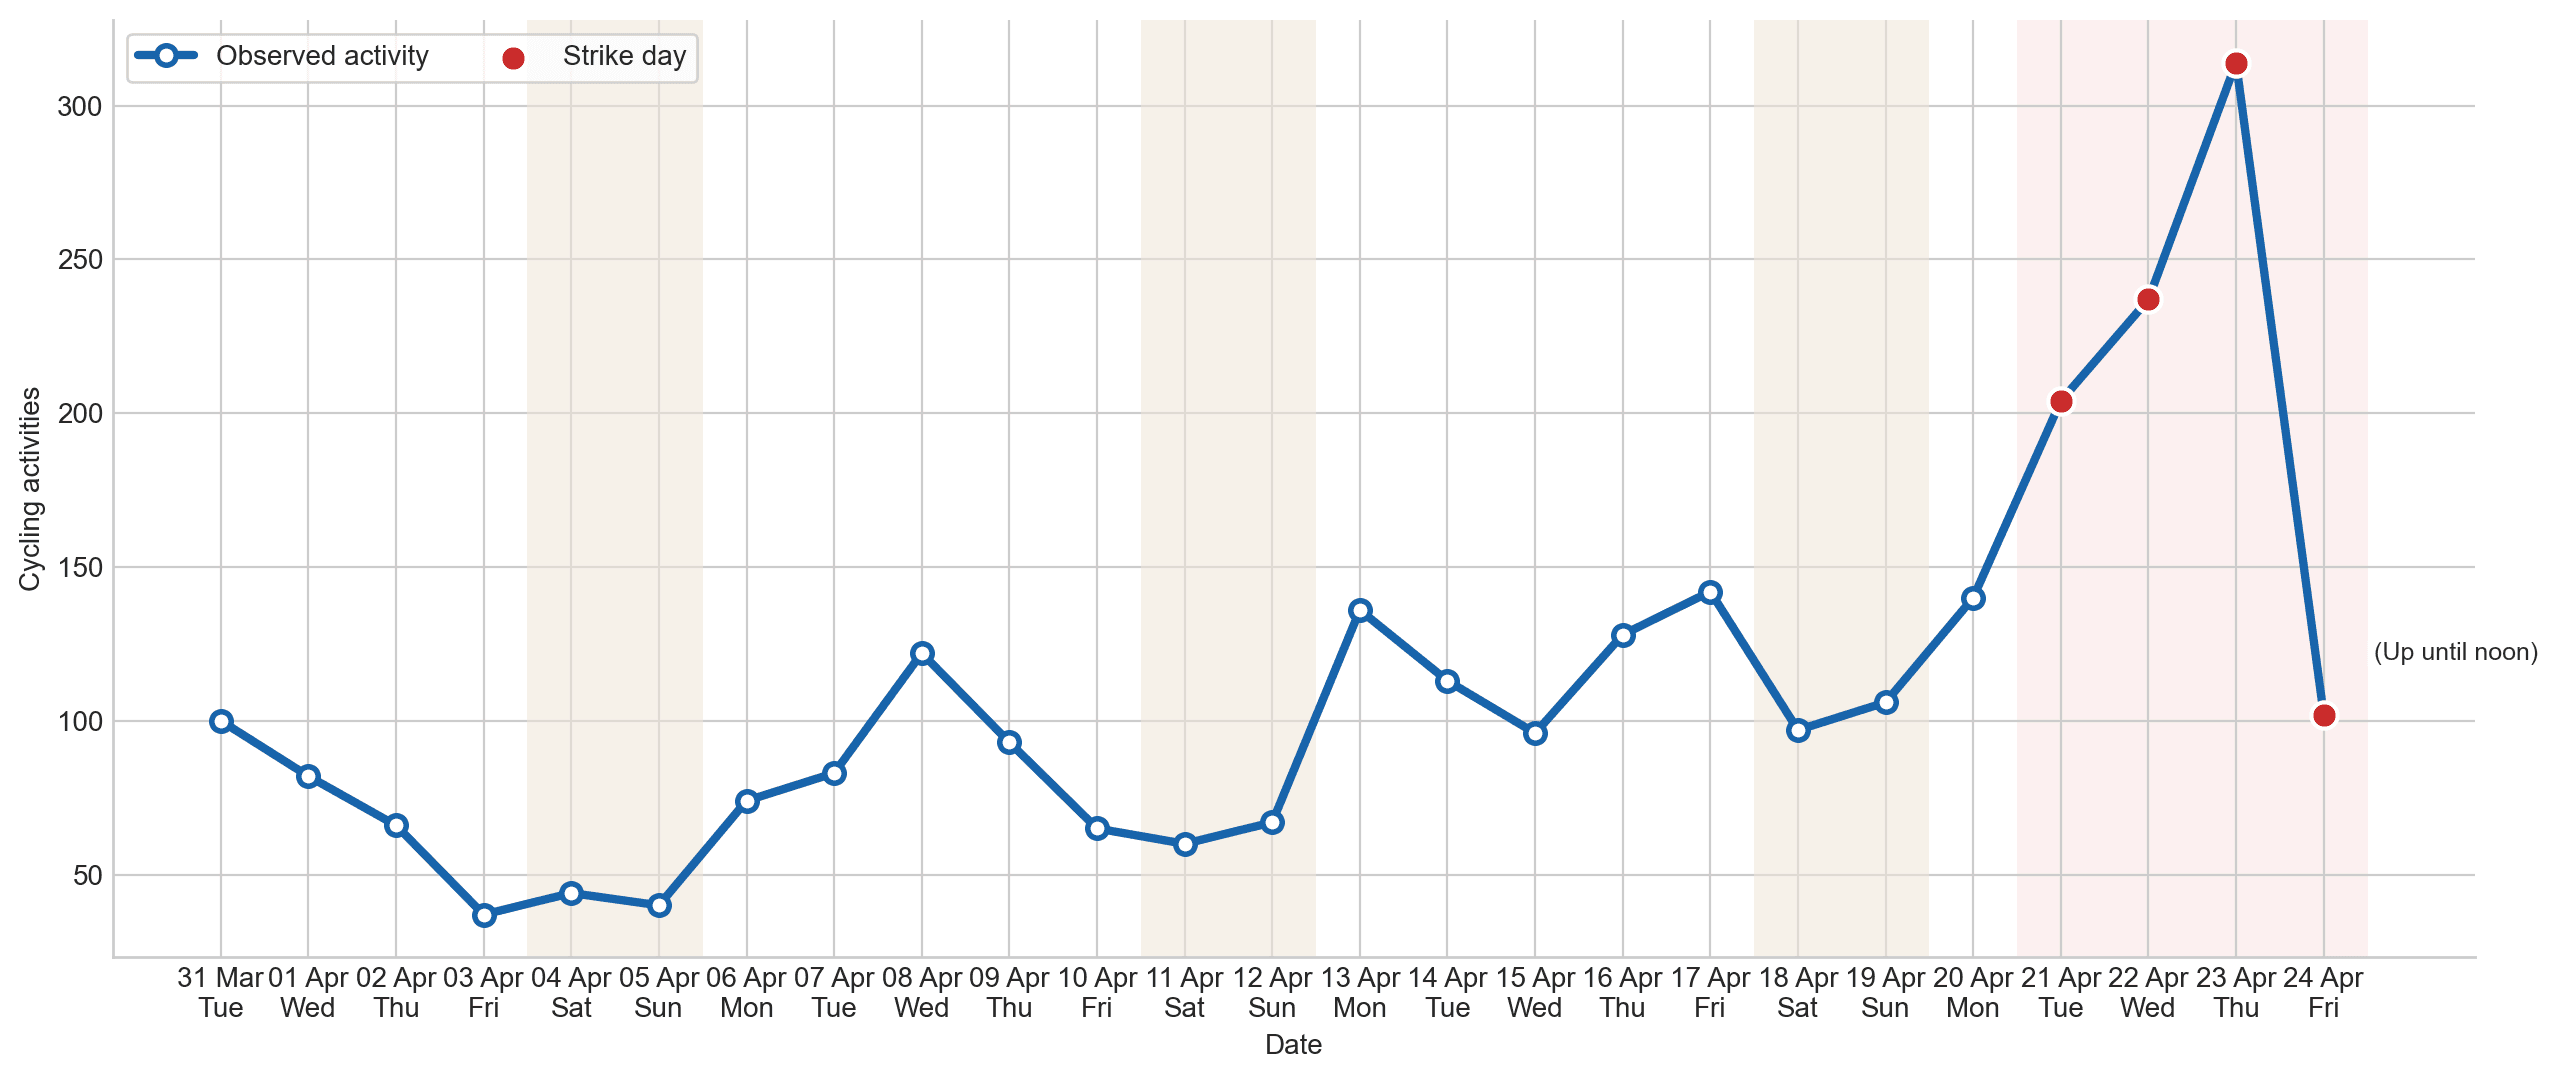
Users who appeared during the strike had been much less active beforehand, about 18.9% of strike users had not recorded any rides in the previous 6 weeks at all.
Get the latest Terra Research reports and insights every week as soon as they're published.
By continuing, I agree to the Privacy Policy and Terms of Service.

The surge of e-bikes
Whether you are team Lime or team Forest, one thing is the same: if it’s a standard UK e-bike, it should stop assisting at around 25 km/h.
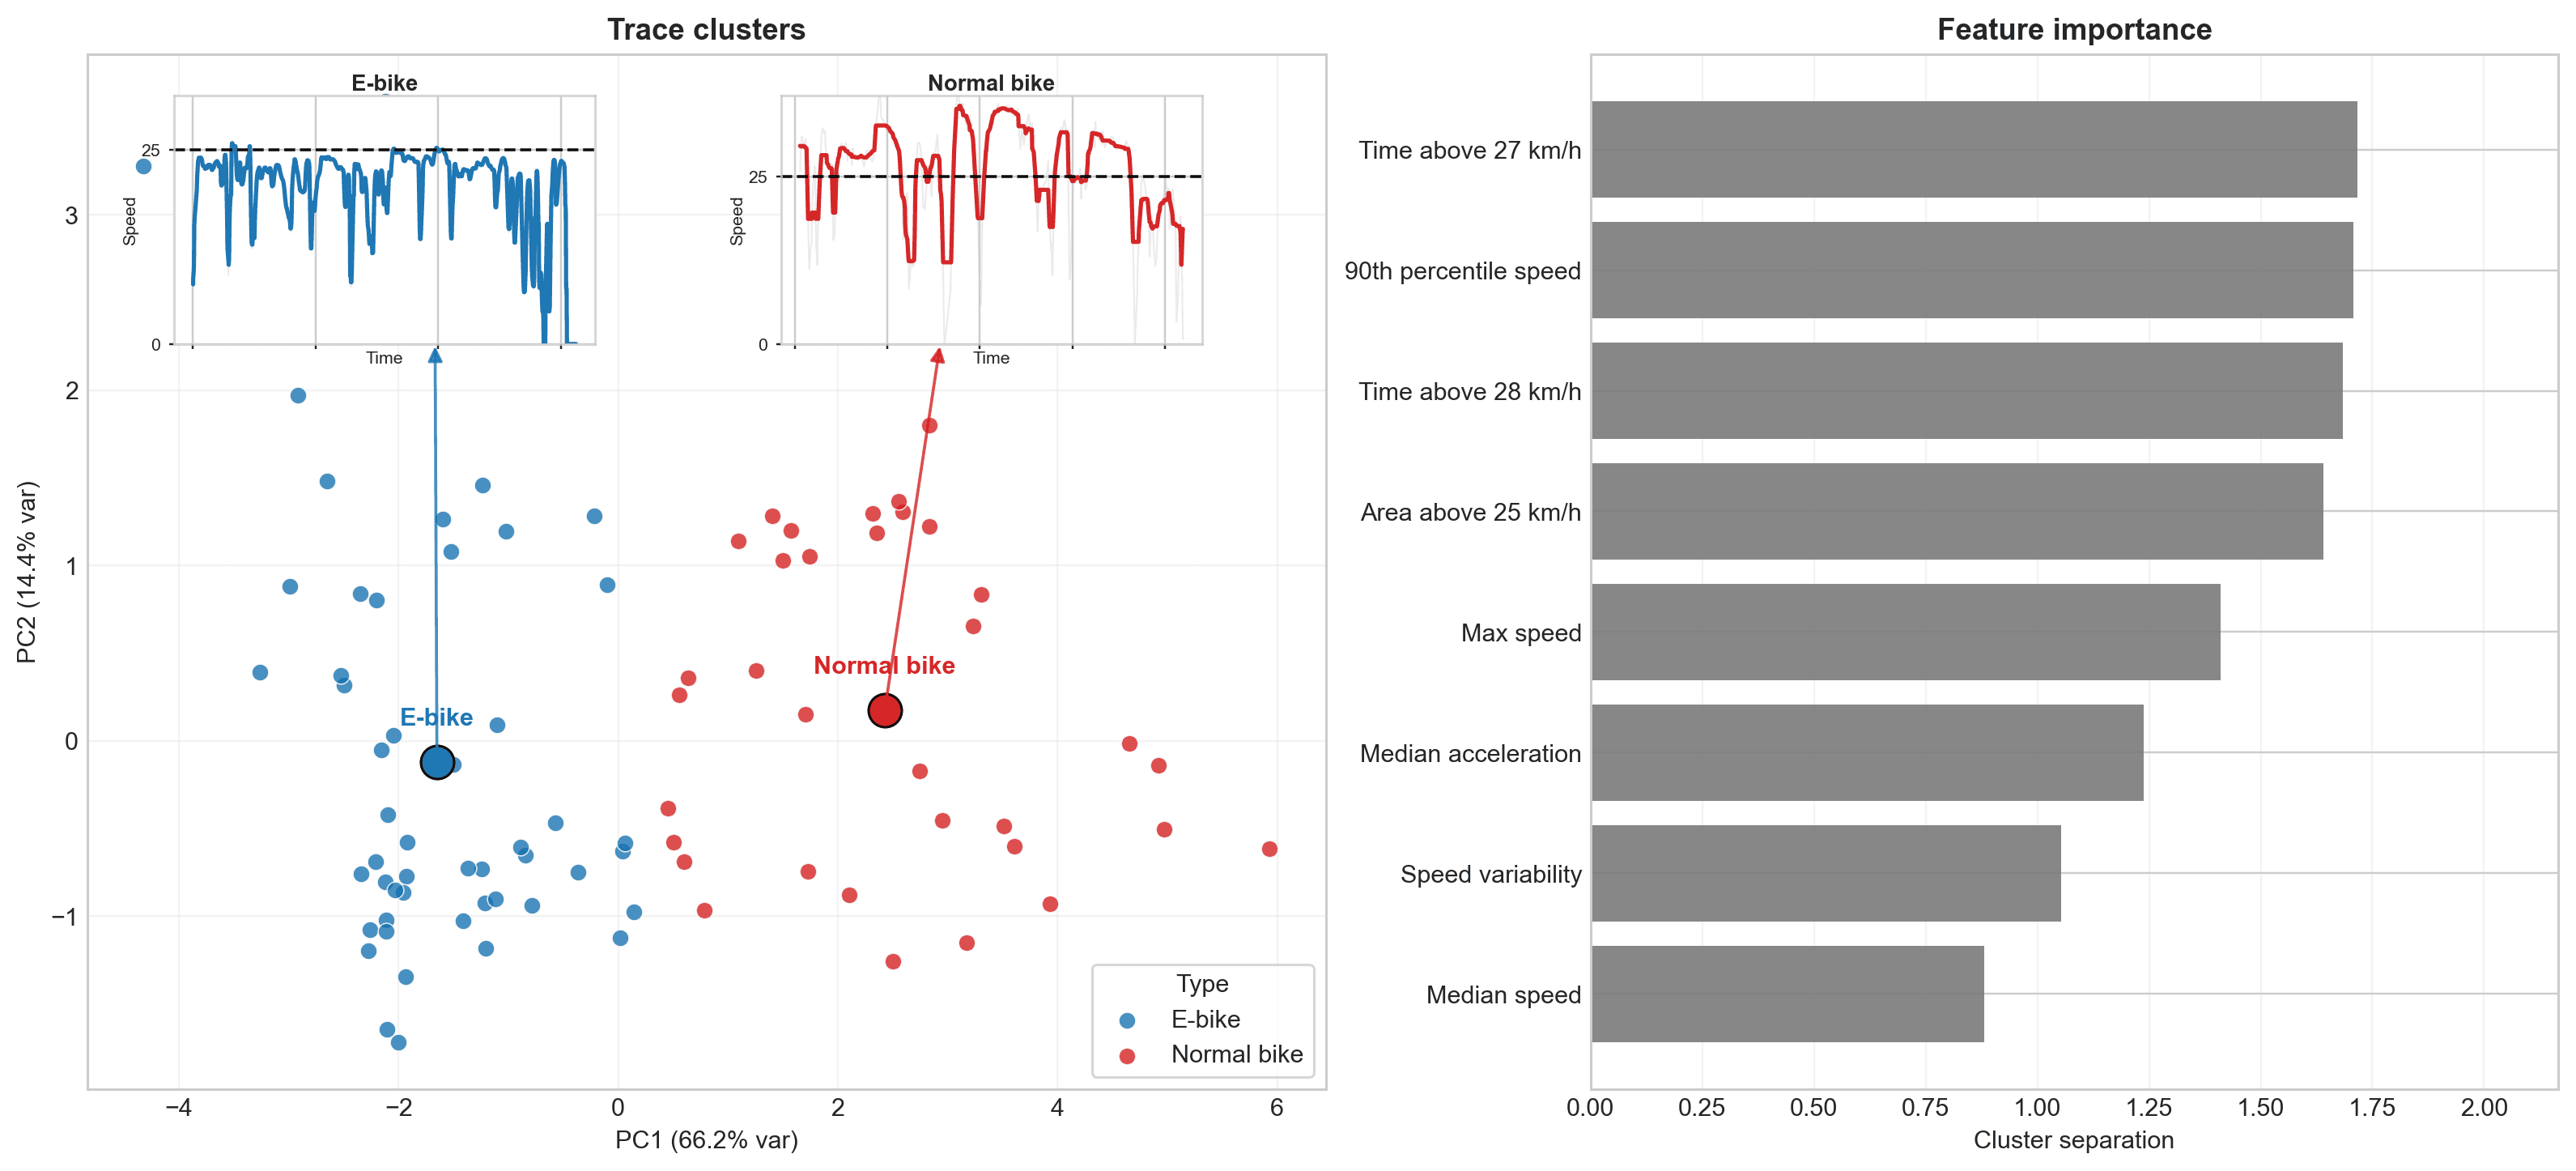
To separate likely e-bike rides from normal bike rides, we used unsupervised k-means clustering with k = 2 on sampled weekday commute speed traces. Each ride was represented using cap-sensitive features: median speed, 90th percentile speed, speed variability, maximum speed, time spent above 27 km/h, time spent above 28 km/h, the integrated area above the 25 km/h cap, and median absolute acceleration. All features were z-score standardised before clustering. The feature set was chosen to maximise separation in PCA space while keeping the split interpretable. The cluster with lower upper-tail speeds and much less time above the cap was labelled E-bike, and the other cluster was labelled Normal bike.
The biggest discriminatory feature was not average speed but what happens in the upper tail of speed distributions. That is exactly what you would expect if one group is being constrained by a speed limit and the other is not.
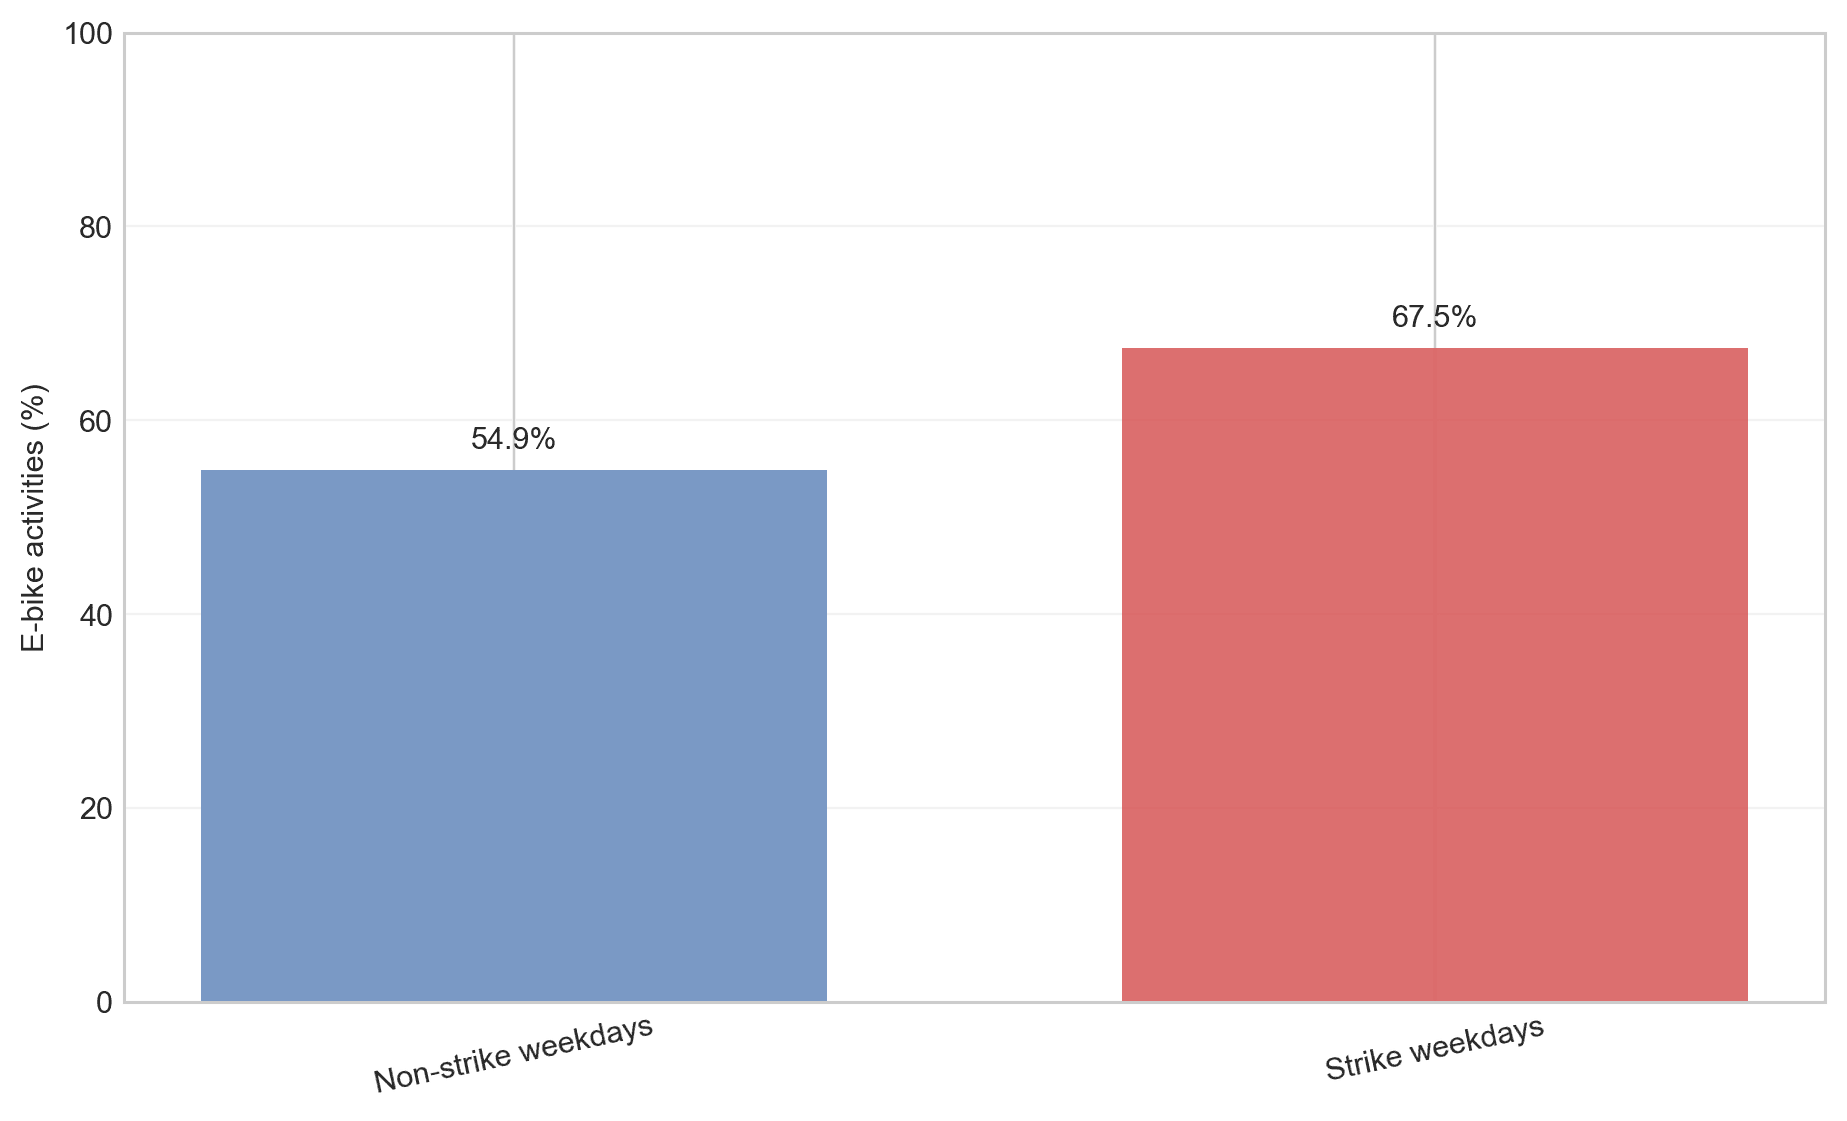
Once those activities were labelled, the strike effect was pretty clear. In the sampled rides:
- on non-strike weekdays, 54.9% activities were classified as e-bike
- on strike weekdays, 67.5% activities were classified as e-bike
- median speed on strike days drops from 23.11 km/h to 21.44 km/h
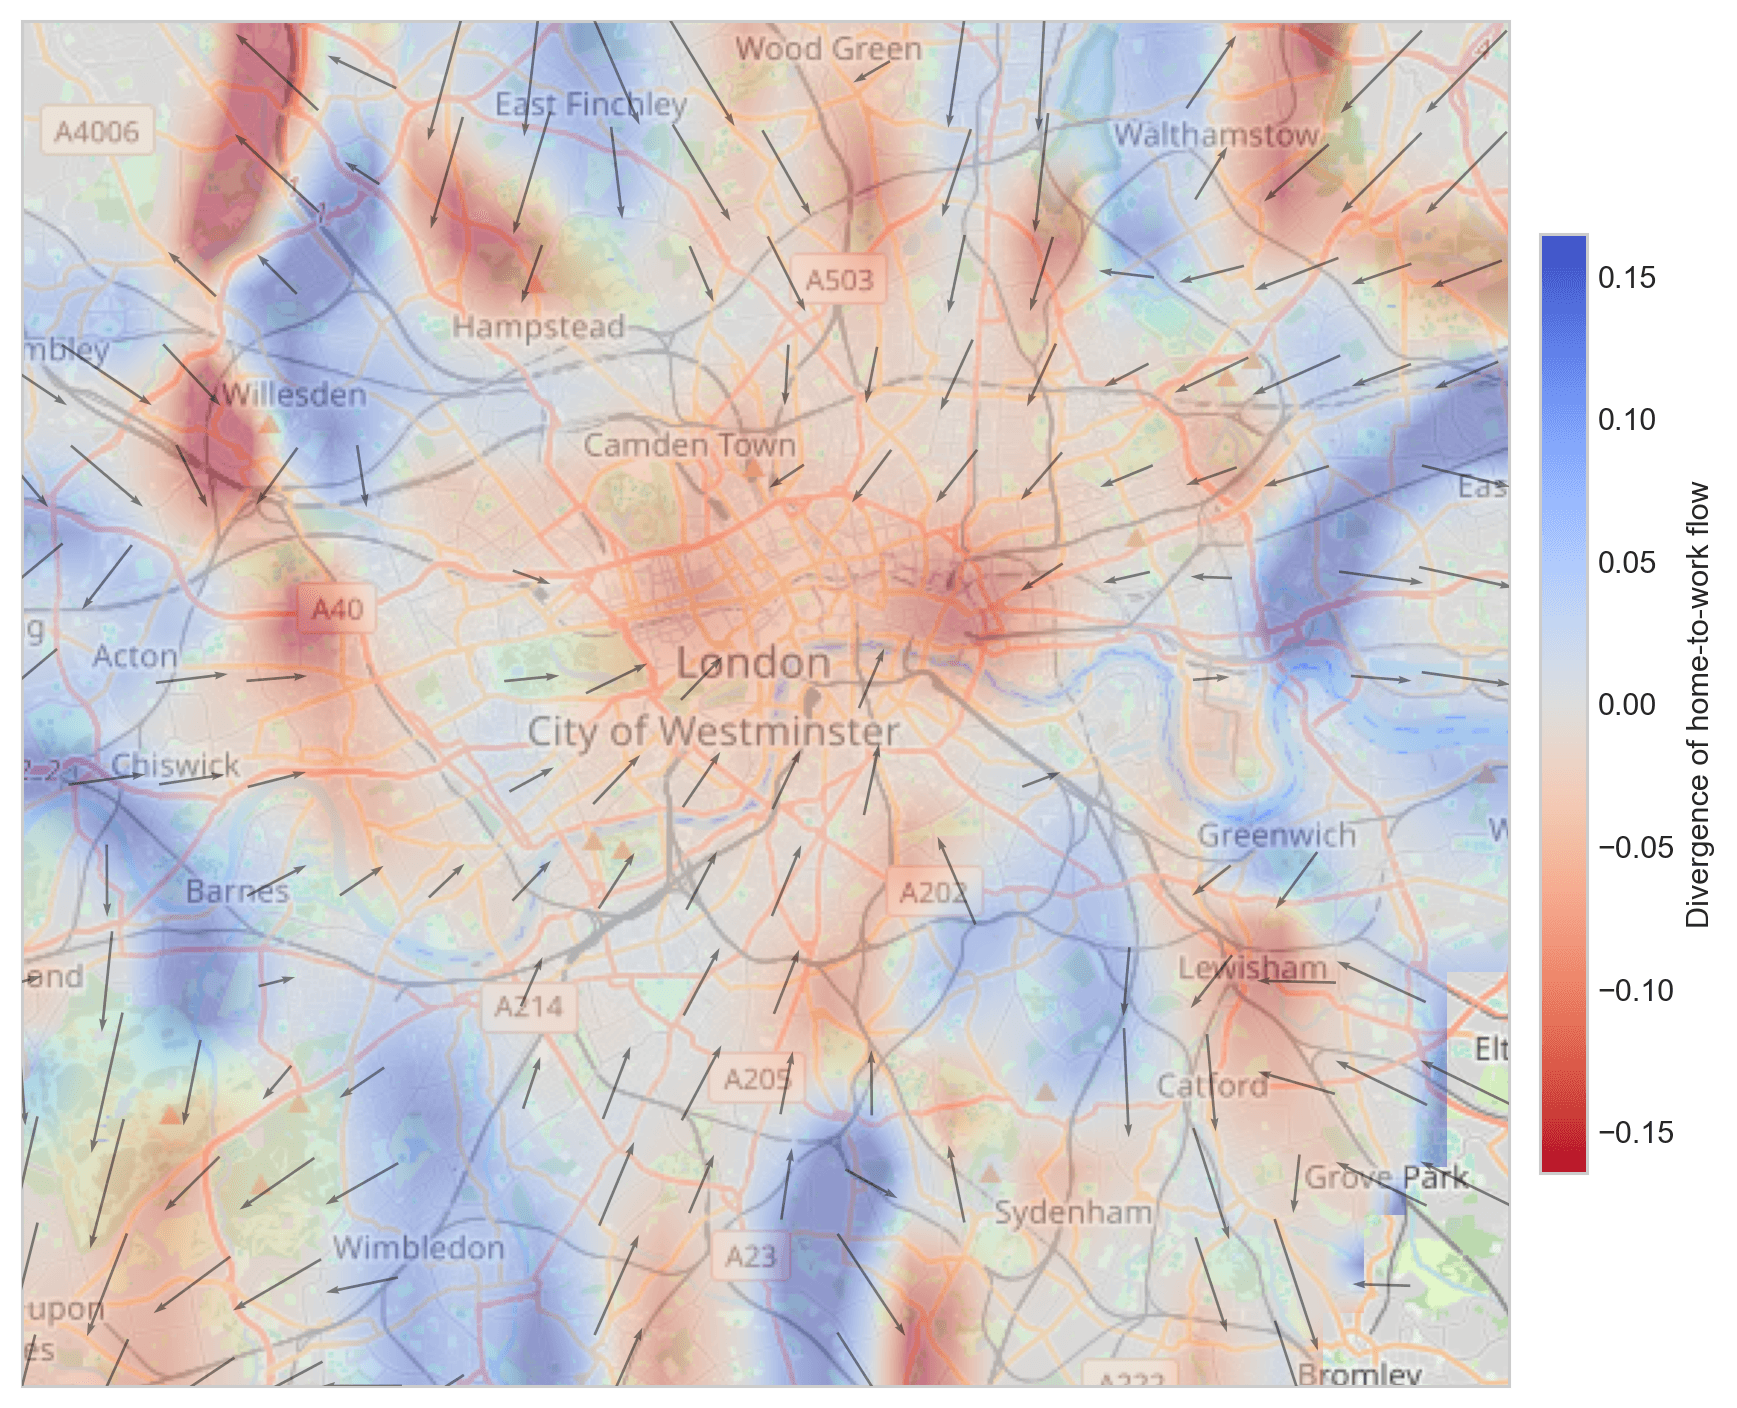
Where do people commute to and from?
The spatial picture is just as interesting. The weekday map includes 1,566 cycling activities from 289 users. Blue circles show likely trip sources (where people go from), and red circles show likely sinks (where people go to). Can you find your local e-bike dock inside a blue circle and your office inside a red circle?
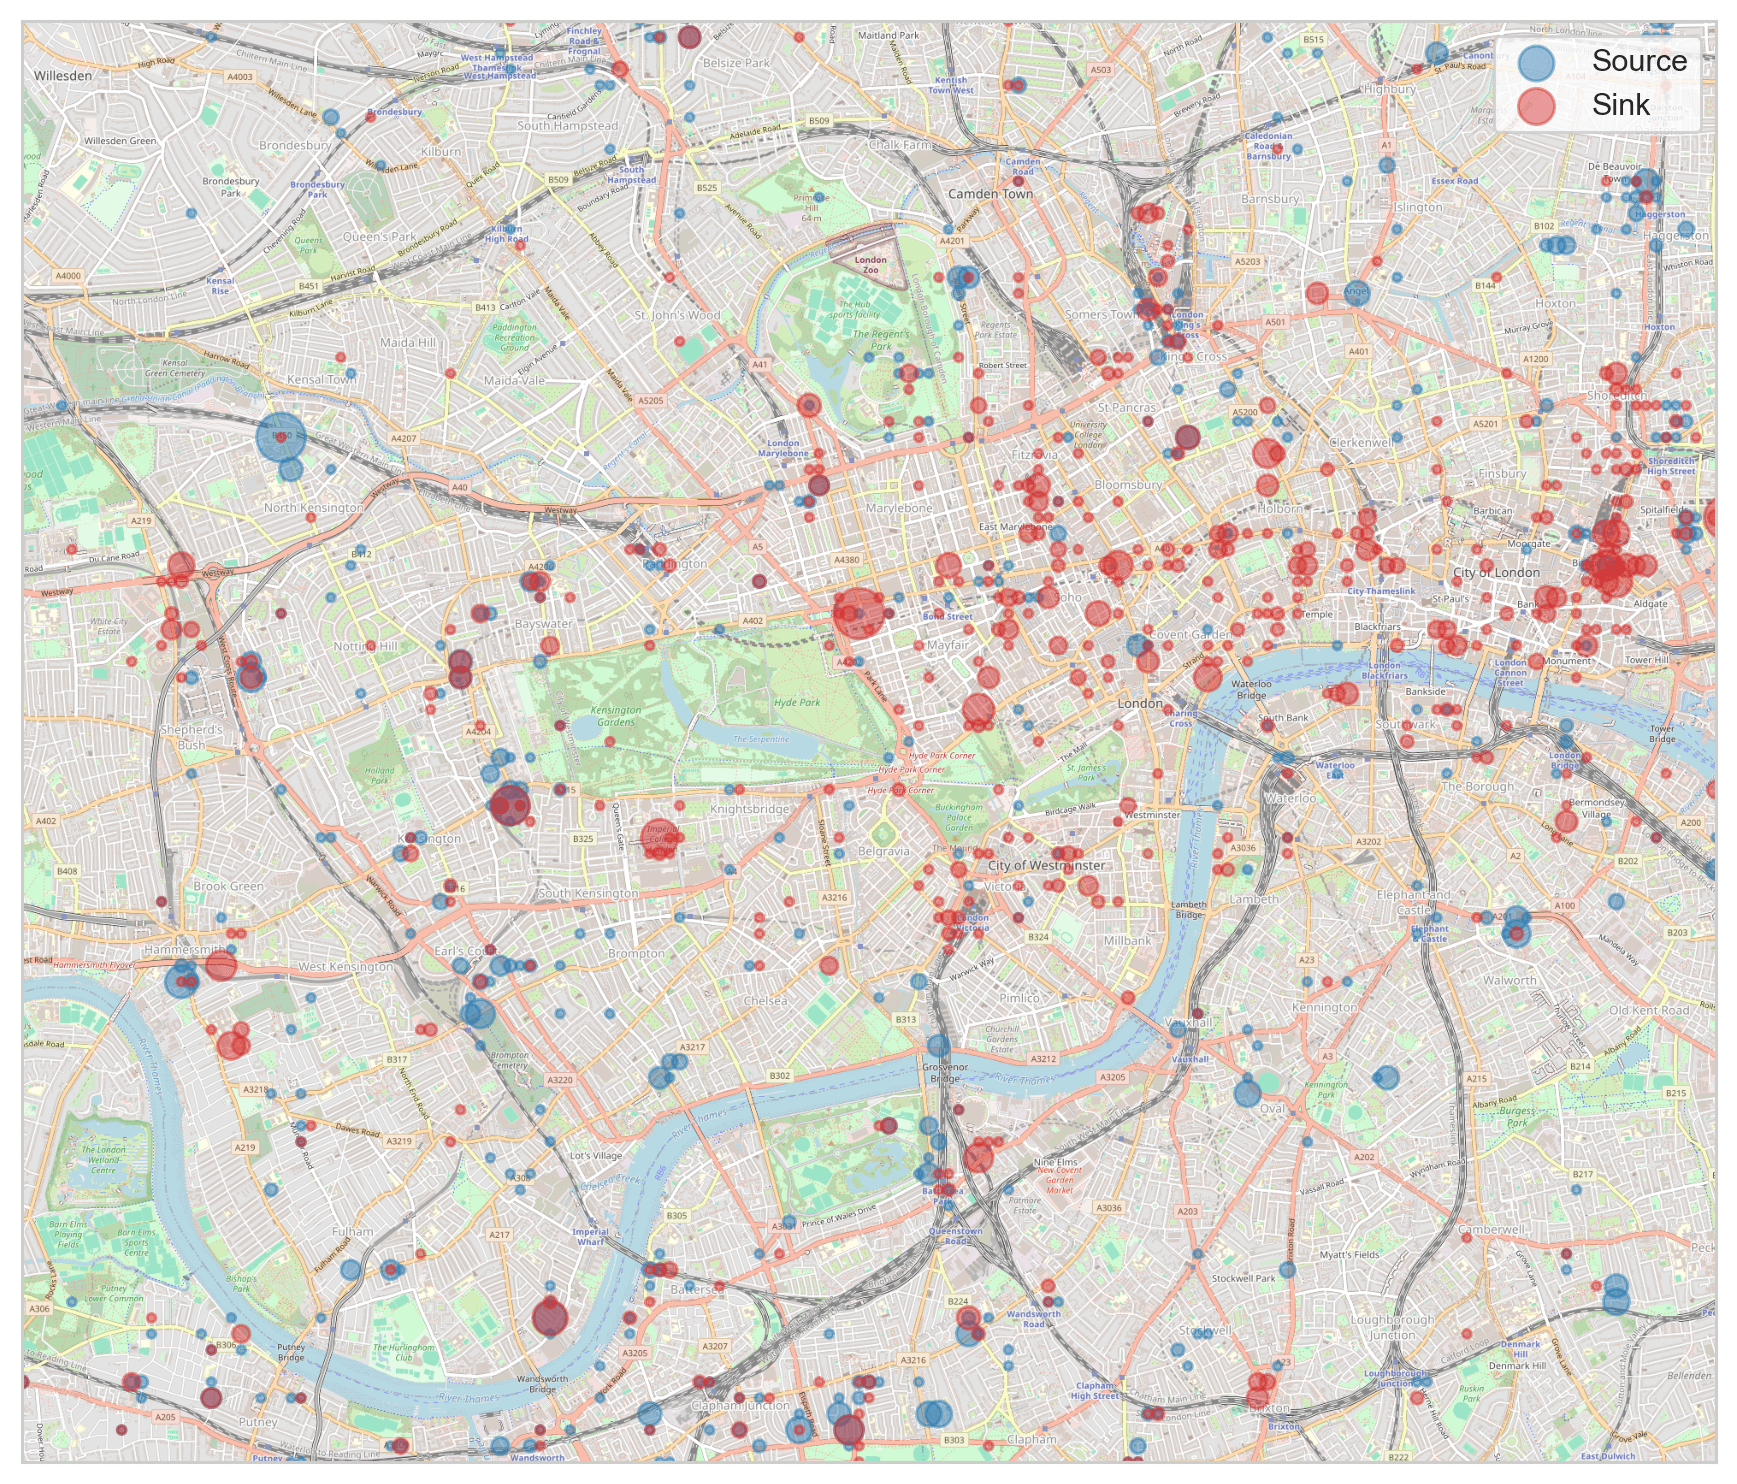
Another interesting finding, people tend to live close to work and commutes are often quite local. While Central London still acts as a major sink, many patterns also show short-to-medium commutes between nearby residential and work areas. For example, people living around Wimbledon tend to commute further south-west.
What this says about London
None of this is especially surprising after experiencing the strike first hand. When the Tube becomes unreliable, London does not stop moving and people cycle more, often relying on e-bikes. TfL strikes may disrupt the network but they also reveal something else about the city: Londoners are very good at finding another way home.
Continue reading

Marathon Series
The Data Behind the London Marathon
While Sabastian Sawe was busy breaking the two-hour marathon barrier in London, the watches of 571 amateur runners told a quieter but equally fascinating story. GPS devices over-measured the course by 527 metres on average, faster runners ran with higher heart rates than the slower ones did, and Coros watches reported 47% more calories per kilometre than physiology actually supports.
April 27, 2026

Endurance Training
Running Is The Hardest Endurance Sport? Not so Fast
Which sport is hardest on the heart? We ran the question through hundreds of thousands of sessions across nine activity types. Running dominates minute-for-minute. It has the highest average, highest peak, highest sustained intensity. But its shorter sessions mean total cardiovascular load per outing often falls behind skiing or hiking. The shape of the heart rate curve tells a different story for every sport, and the weighting method you pick changes the answer.
April 23, 2026

Heat Exposure
Cold Plunging Might Make Your Biomarkers Worse
We analyzed large-scale wearable data to understand what cold exposure actually does to your body. Sporadic plunges act as a stressor, raising sleeping heart rate. But with consistent use, around 3 sessions every 14 days, the effect flips, improving recovery and sleep scores. We also found that women's responses differ significantly by menstrual cycle phase.
April 14, 2026

Winter Training
How The Fittest Do Winter
We analyzed 856,000 exercise sessions from Europeans across 20 countries to find out how people really train across the year. The data reveals three distinct exerciser phenotypes — and an entire category of athlete that didn't exist a decade ago, invented by indoor cycling platforms like Zwift.
April 9, 2026