We use cookies to enhance your browsing experience and analyse our traffic. By clicking “Accept All”, you consent to our use of cookies according to our Cookie Policy. You can change your mind any time by visiting out cookie policy.
Running Is The Hardest Endurance Sport? Not so Fast
Which sport is hardest on the heart? We ran the question through hundreds of thousands of sessions across nine activity types. Running dominates minute-for-minute. It has the highest average, highest peak, highest sustained intensity. But its shorter sessions mean total cardiovascular load per outing often falls behind skiing or hiking. The shape of the heart rate curve tells a different story for every sport, and the weighting method you pick changes the answer.
Running really is the hardest sport per minute — highest session average, highest peak, highest sustained intensity ratio. No matter how you cut the data, nothing else comes close minute for minute.
Walking's "high" intensity ratio is a statistical illusion — on paper it ranks just behind running. But it comes from flat, low-amplitude sessions with low average and low peak HR. A steady stroll produces the same ratio as a hard effort, without any of the effort.
Downhill skiing is all peaks and troughs — peak HR rivals outdoor cycling, but average HR sits near walking. That 47 bpm gap is the signature of a stop-and-go sport: short bursts, long lifts, and a lot of standing around in the cold.
I've had this debate a thousand times. In changing rooms, on training camps, at race briefings, what is the hardest endurance sport? And the honest answer is that "hard" means different things depending on who's asking.
Psychologically hard, as in hard to motivate yourself to do? For me, that's swimming. Always has been. Staring at a black line for hours requires a kind of mental stubbornness that I find harder than any run. High risk? Maybe skiing, where a moment's lapse can end your season. Hard to master technically? Cycling in a peloton, open water swimming in a pack, cross-country skiing on a frozen track. It’s probably very individual.
But hard physiologically, as in, which sport pushes the cardiovascular system the hardest during a typical session? That's a question I thought I could try to answer with data.
The dataset comprised of thousands of European athletes across nine activity types. Every sport leaves a different cardiovascular fingerprint. And some of what we found contradicts the obvious.
Every sport has a heart rate fingerprint
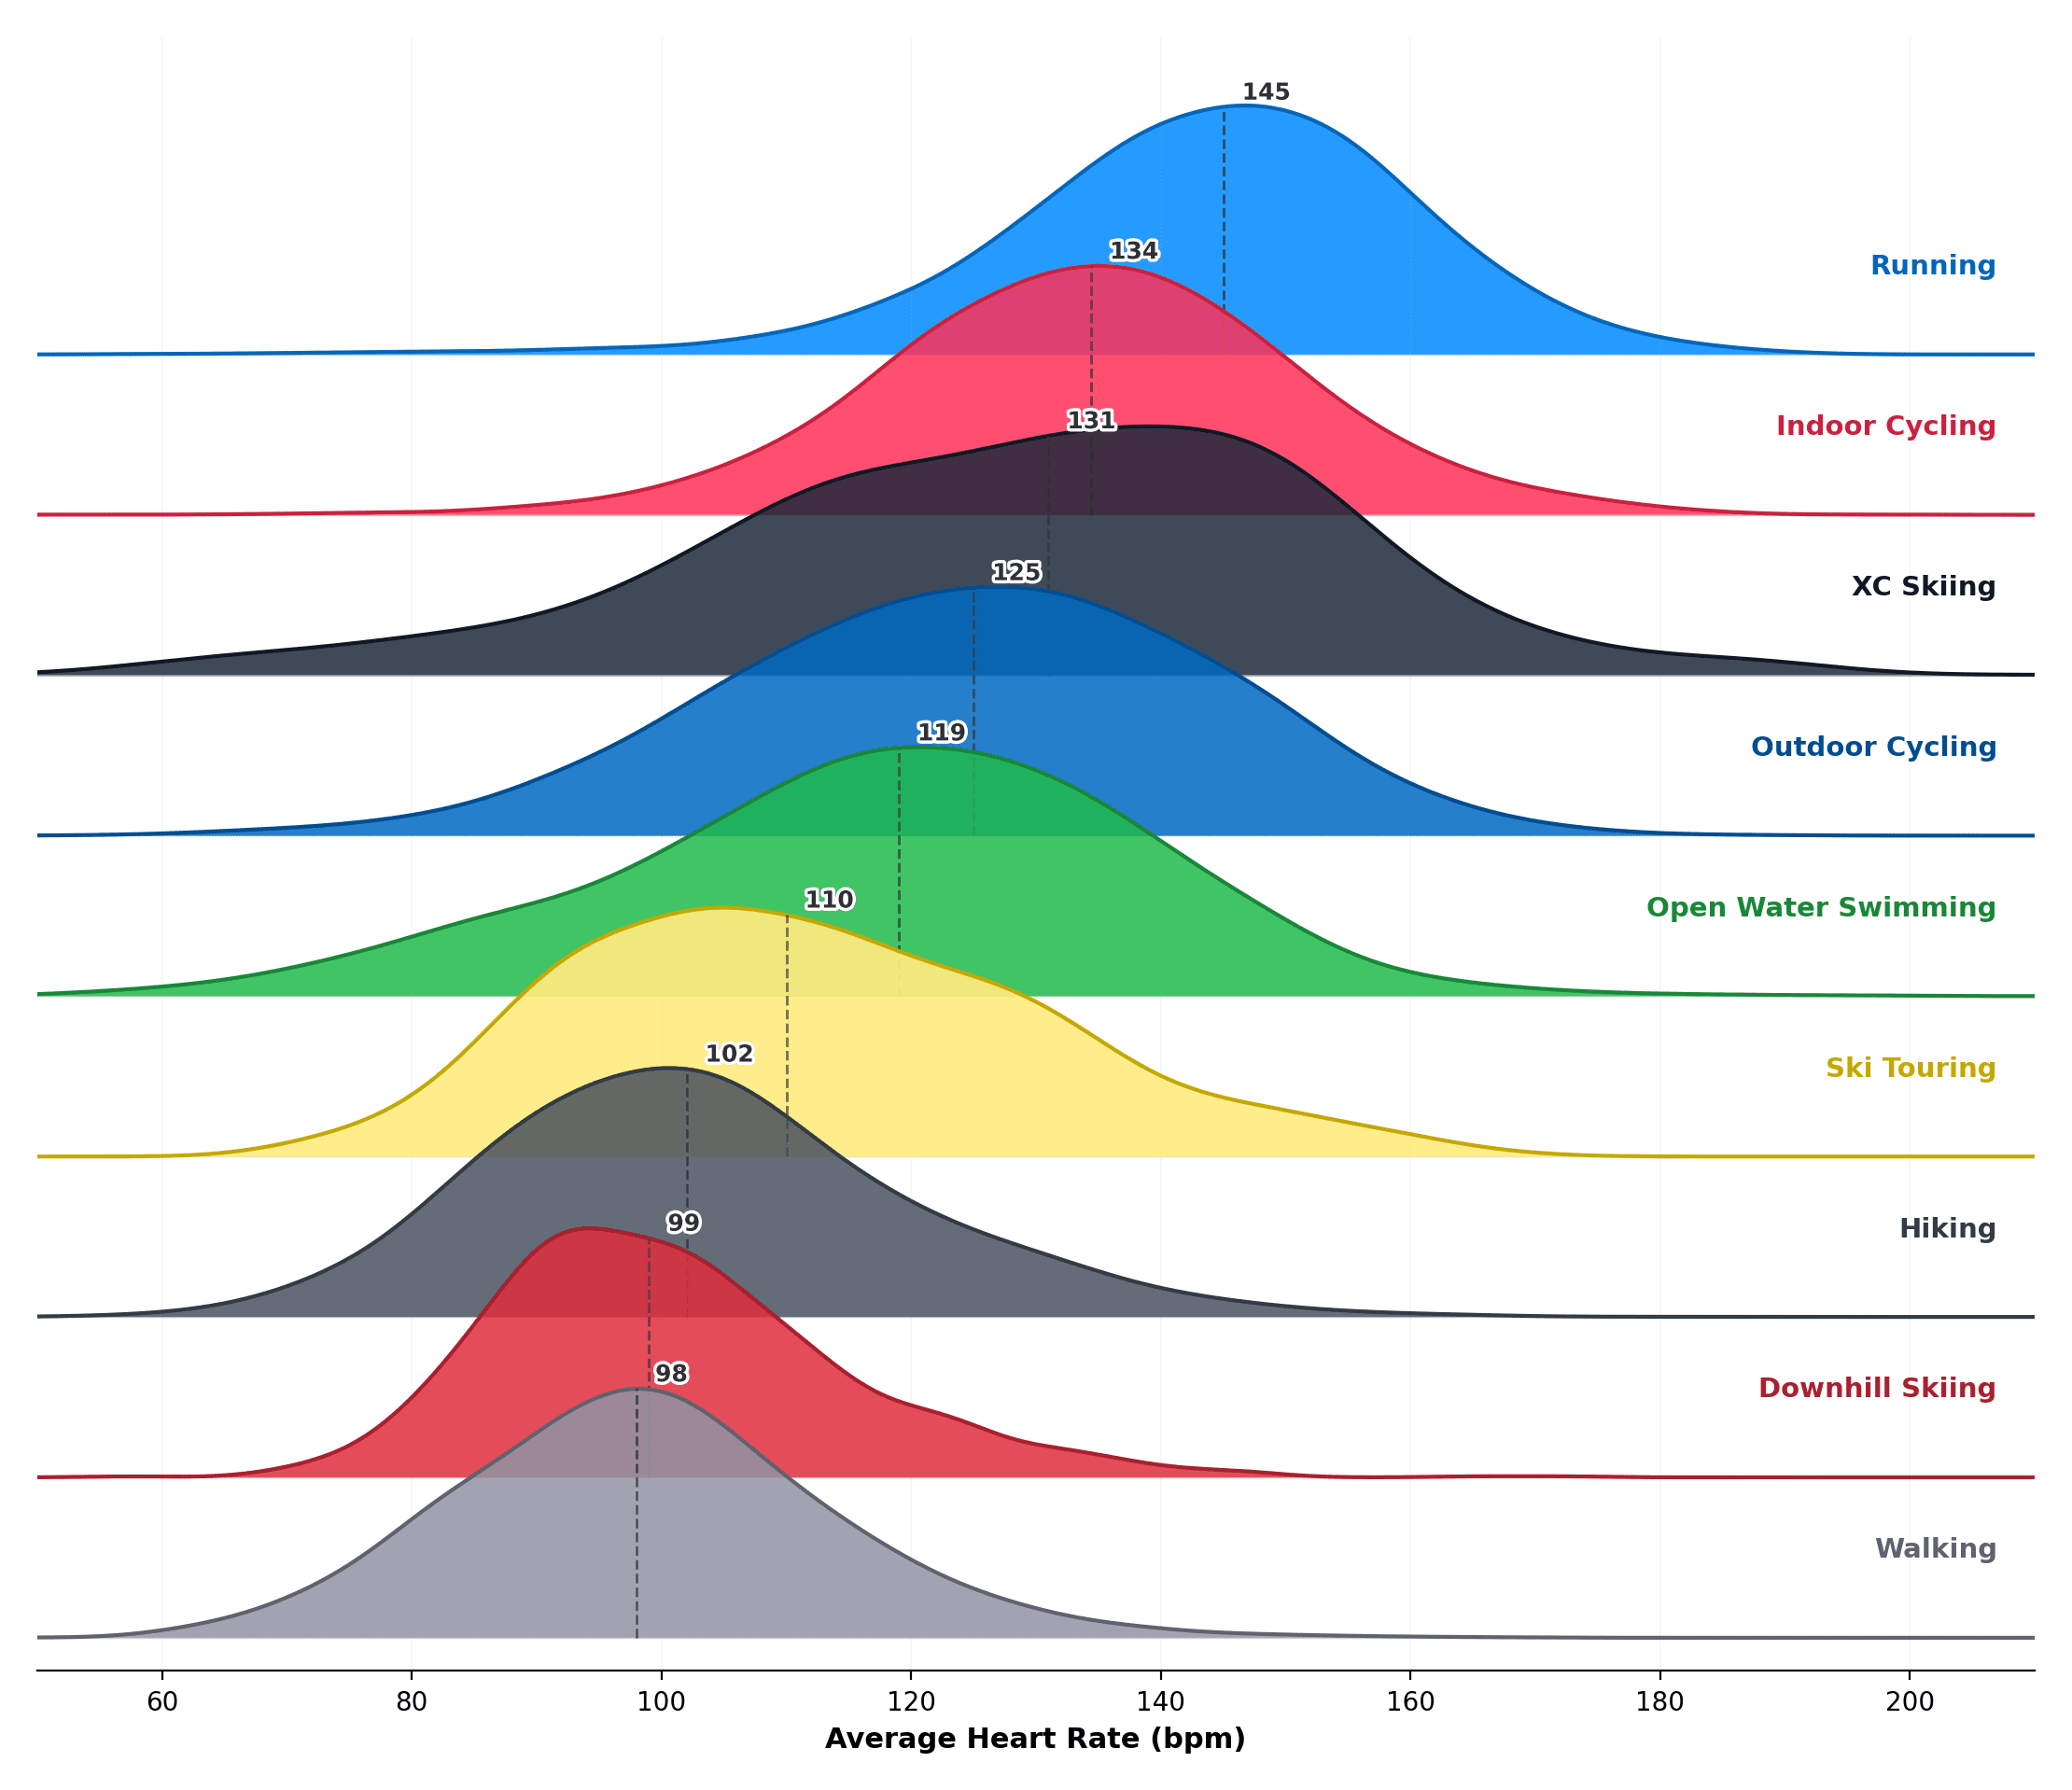
Figure 1: HR Distribution Ridge Plot. Each distribution is normalized to its own peak to compare shapes across modalities. Dashed lines indicate the median. Running is the most concentrated and furthest to the right; ski touring and hiking are more spread out, highlighting variable session intensity.
When we plot the distribution of session average heart rate for each modality, the shapes are immediately distinct. Running produces a tight, right-shifted bell centered at 145 bpm; people run at a consistently high heart rate with little session-to-session variation. Outdoor cycling is relatively broad and flat, reflecting the reality that a commute, a cafe ride, and a race all count as "cycling." My recent favorite activity, Ski touring, spreads widely of all, probably because there's plenty of down hills in the data. Walking is wide but sits furthest left. Downhill skiing, for most, is not a particularly arduous cardio activity.
The shape of the distribution tells you more about the nature of a sport than any single summary statistic.
Get the latest Terra Research reports and insights every week as soon as they're published.
Three intensity tiers — and the groupings aren't obvious
Median session average heart rate clusters into three distinct bands:
Tier
Modalities
Median Avg HR
High
Running, Indoor Cycling, XC Skiing
131–145 bpm
Moderate
Outdoor Cycling, Ski Touring, Open Water Swimming
119–129 bpm
Low
Walking, Downhill Skiing, Hiking
98–102 bpm
The surprise is not that running tops the list. For me, it's the discrepancy between indoor cycling and outdoor cycling drops (a full 9 bpm). The turbo trainer eliminates coasting, traffic lights, descents, and for many people, the joy of riding for fun — the things that suppress average HR outdoors. I explored this indoor-outdoor divergence in detail in our previous post.
Running's high intensity is genuine, not an artefact
A high average on its own doesn’t necessarily tell us very much. Maybe even one who runs has a very high Max HR, it’s a population of fitter people, not a harder exercise? So I calculate the intensity ratio, the session average as a fraction of the session peak. Running’s highest ratio of 87.5% could mean two things: the average is genuinely high, or the peak is suppressed. This matters because the metric alone can't tell you which.
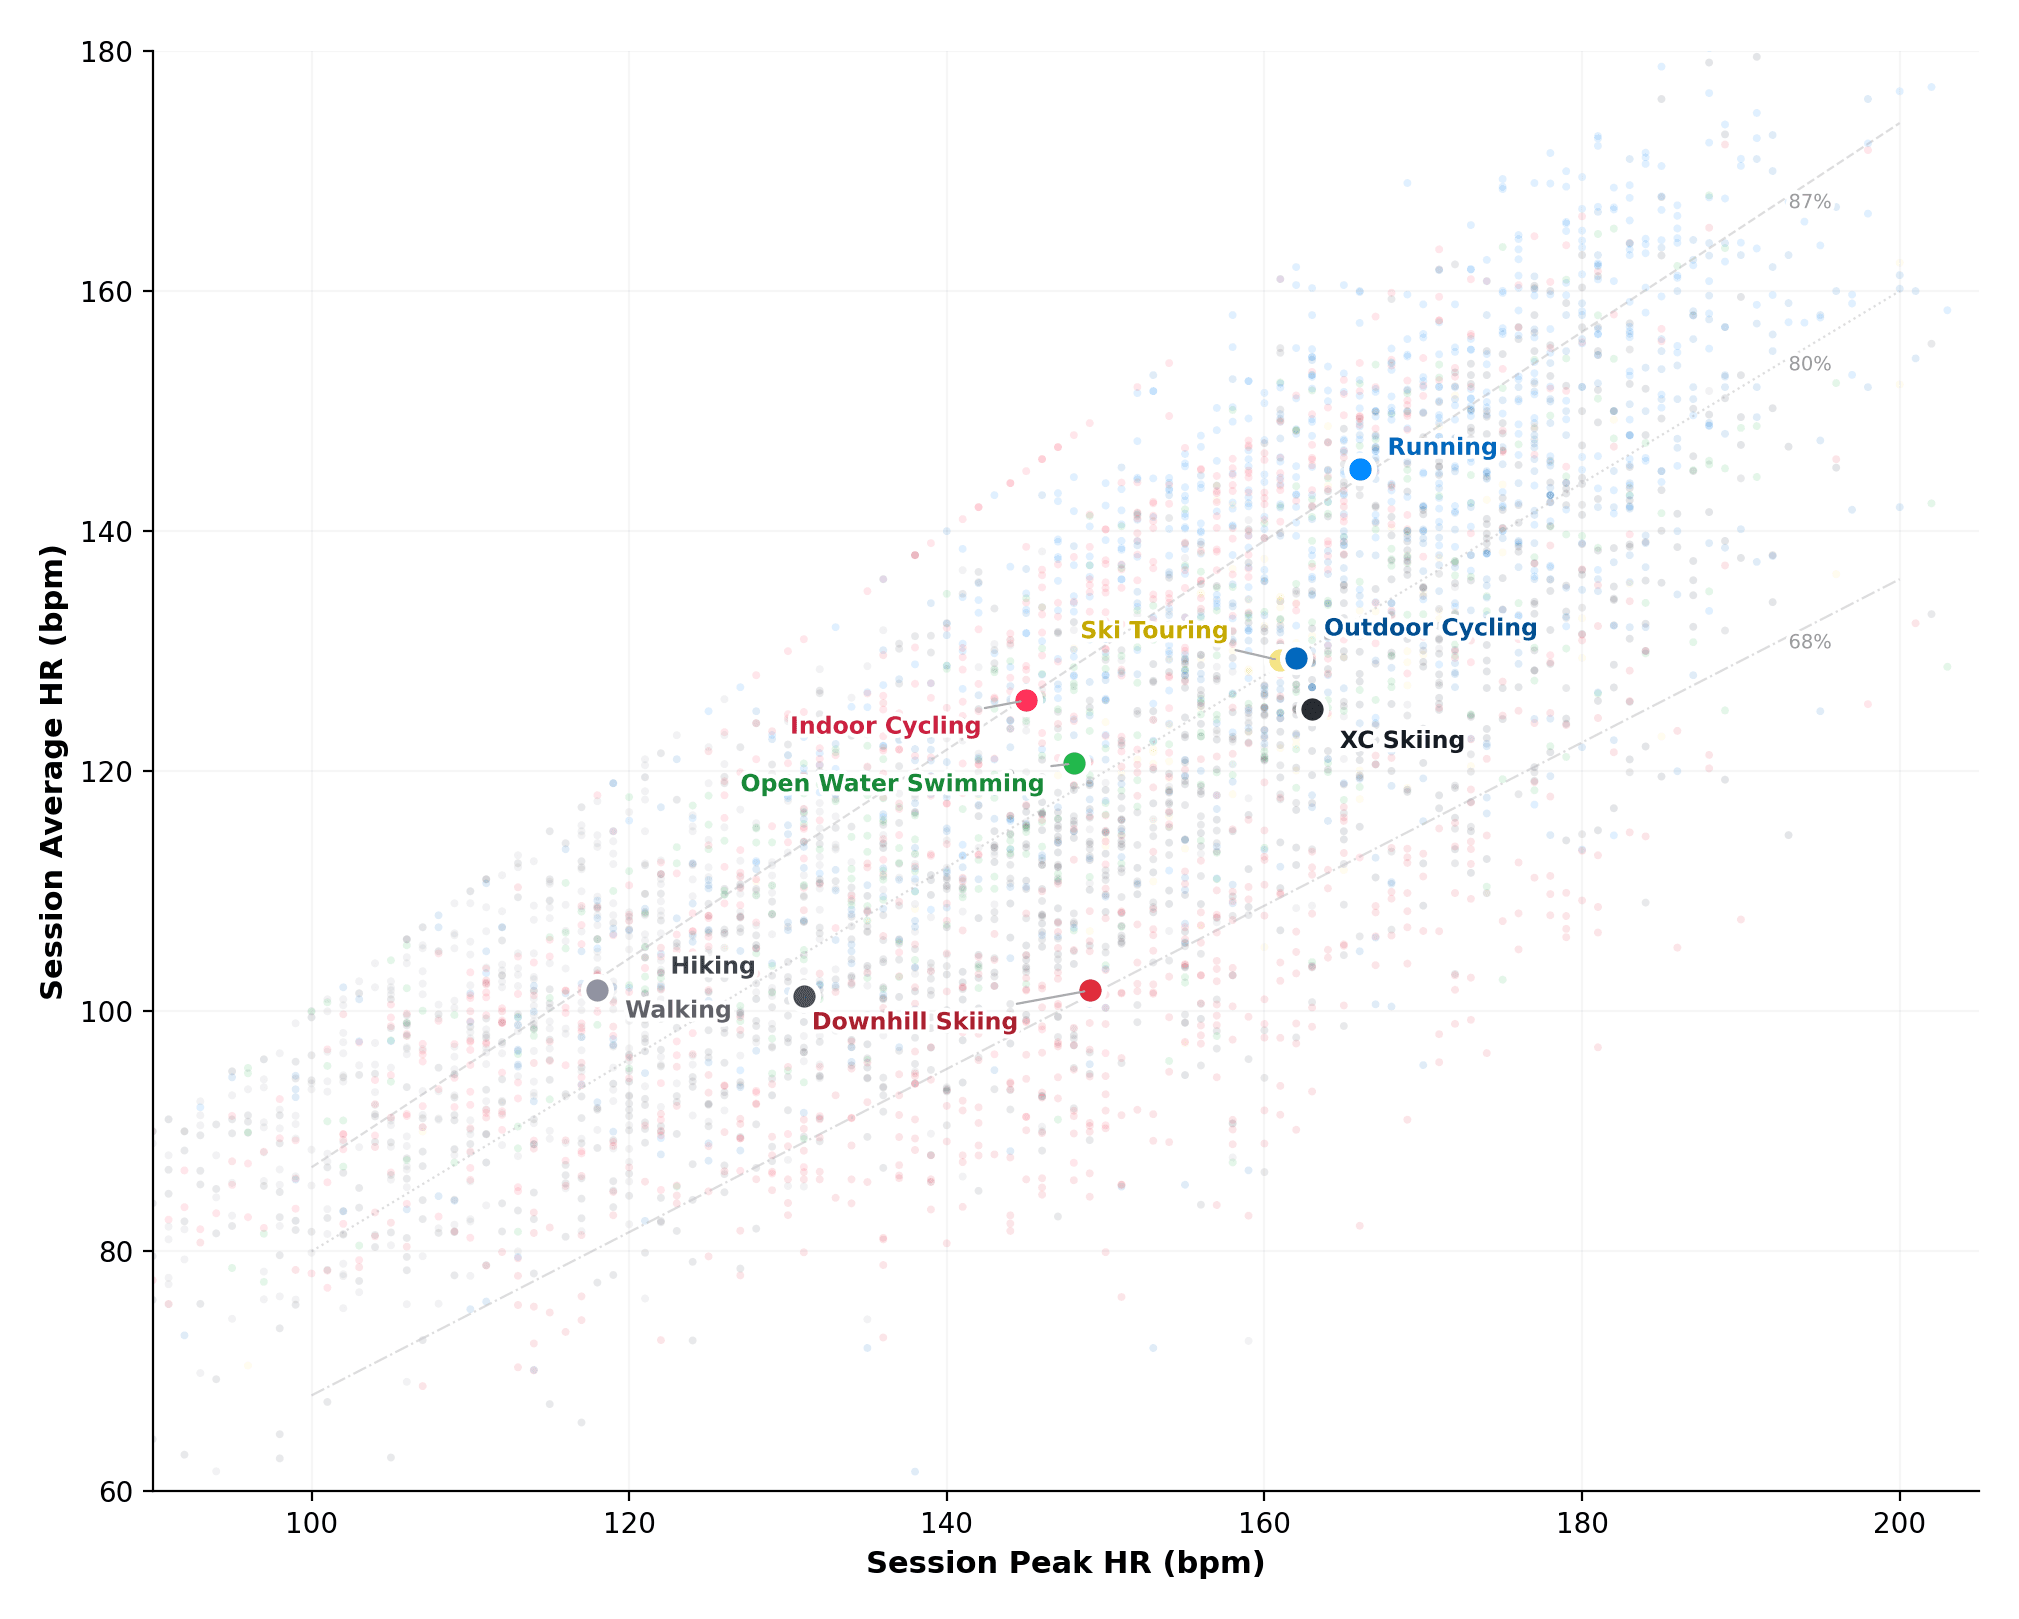
The scatter plot resolves it. Running occupies the top-right quadrant: both the highest average HR (145 bpm) and the highest peak HR (166 bpm) of any modality. There is no ambiguity. Runners hold a high heart rate throughout and push to the highest peaks. The 87.5% ratio reflects genuine sustained output.
Figure 2: Average HR vs Peak HR Scatter. Running occupies the top-right quadrant: both the highest average and highest peak HR, confirming genuine sustained high output. Walking clusters bottom-left — its high ratio (86%) reflects a flat, low-amplitude session rather than true intensity.
Walking's 86% ratio is a statistical illusion
Walking ranks third in sustained intensity at 86.3%, just behind running and indoor cycling. On paper, that looks like genuine sustained effort. But the scatter tells the real story: walking clusters in the bottom-left, with both low average (98 bpm) and low peak (118 bpm). Its "high" ratio is simply the absence of intensity variation. A flat, low-amplitude session where heart rate never really goes anywhere produces a ratio that mimics hard exercise.
Downhill skiing has the biggest within-session swings
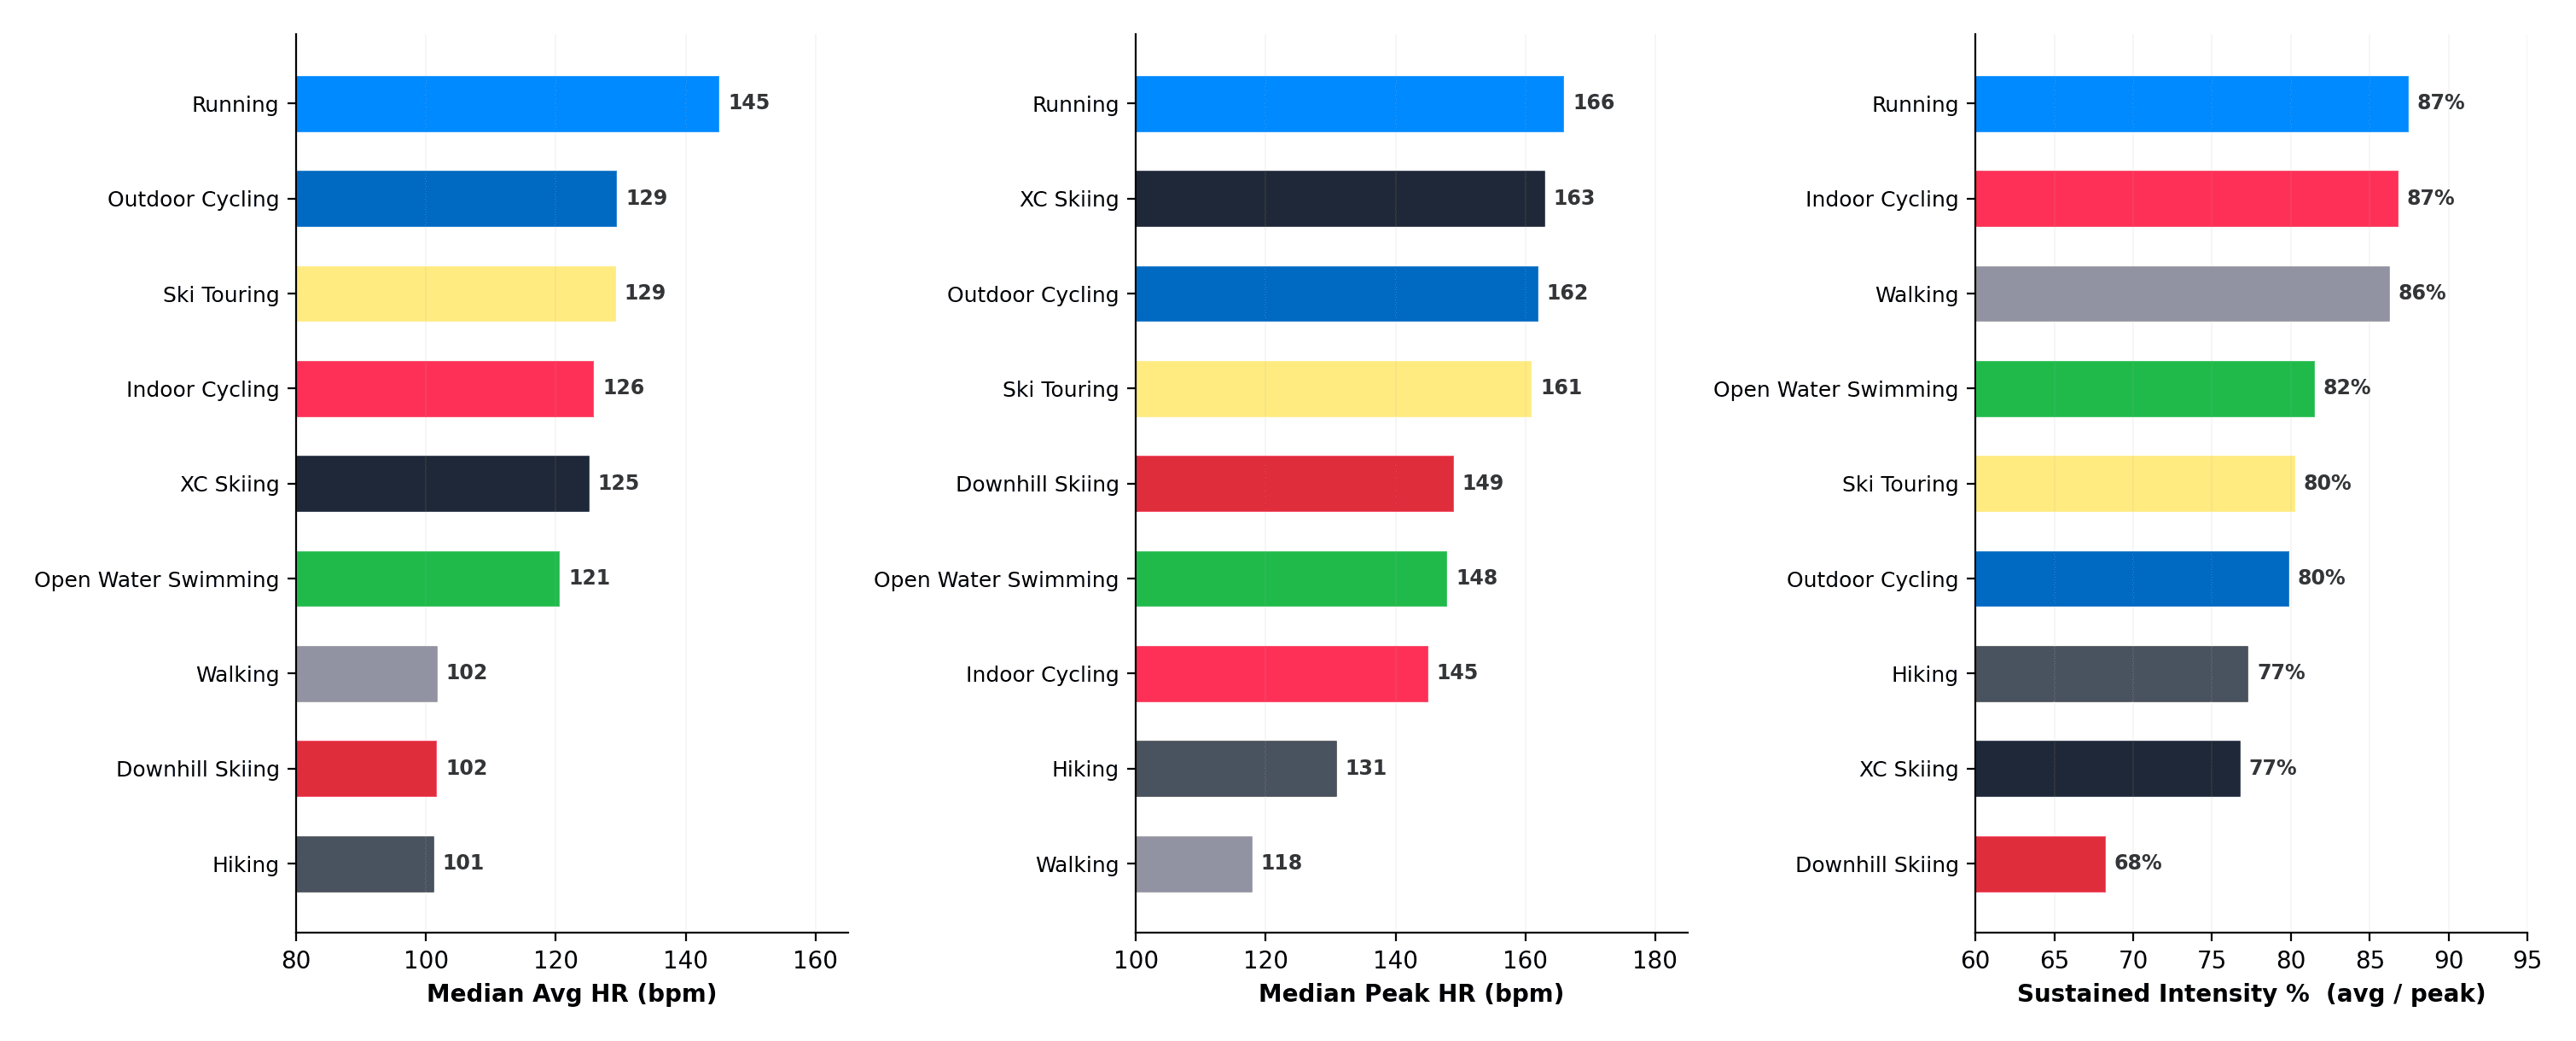
At 68.3%, downhill skiing has the lowest sustained intensity ratio by far. The decomposition shows exactly why. Its median peak HR (149 bpm) rivals outdoor cycling, but its median average (102 bpm) is on par with walking and hiking. That 47 bpm gap is the heart rate signature of a stop-and-go sport: explosive effort on the piste, then lifts, queues, and standing in the cold. Or maybe it’s just blind terror, I get some pretty wild heart rates on gnarly descents.
Figure 3: Sustained Intensity Decomposition (3-panel bars). The ranking shifts between panels reveal the mechanism. XC skiing and outdoor cycling rank top-3 in peak HR but drop sharply in sustained intensity — high peaks with long low-HR recovery phases. Running leads in both average and ratio.
XC skiing peaks like running but sustains like cycling
Cross-country skiing yields the joint-highest median peak HR in the dataset, 163 bpm, virtually tied with running at 166 bpm. Yet its sustained intensity ratio is only 76.8%, seventh out of nine. The mechanism is clear from the decomposition: XC skiing involves explosive hill efforts that spike heart rate to near-maximum, separated by long gliding recovery phases that pull the average down.
This shows up strikingly in the three-panel decomposition, where the ranking reshuffles completely across metrics. XC Skiing jumps from 5th in average HR to 2nd in peak. Indoor Cycling leaps from 8th in peak to 2nd in sustained ratio. The ranking shifts reveal the underlying mechanism, whether a sport's character comes from high sustained effort, high peaks, or the gap between the two.
Indoor cycling is the purest sustained effort after running
Indoor cycling's sustained intensity ratio (86.8%) sits just 0.7 percentage points behind running. That makes sense: both are continuous, self-paced activities with no coasting and no external interruptions. What separates them is the absolute level, indoor cycling's median average HR (134 bpm) is 11 bpm lower than running's. The cardiovascular demand of weight-bearing locomotion at a running pace simply exceeds that of seated cycling at a typical indoor effort, even when the relative intensity profiles are nearly identical.
Within the same person, running still wins
Everything up to this point could be explained away by population differences; maybe runners are simply fitter, or more motivated, or younger. So I ran the analysis that controls for all of that: within-person comparison.
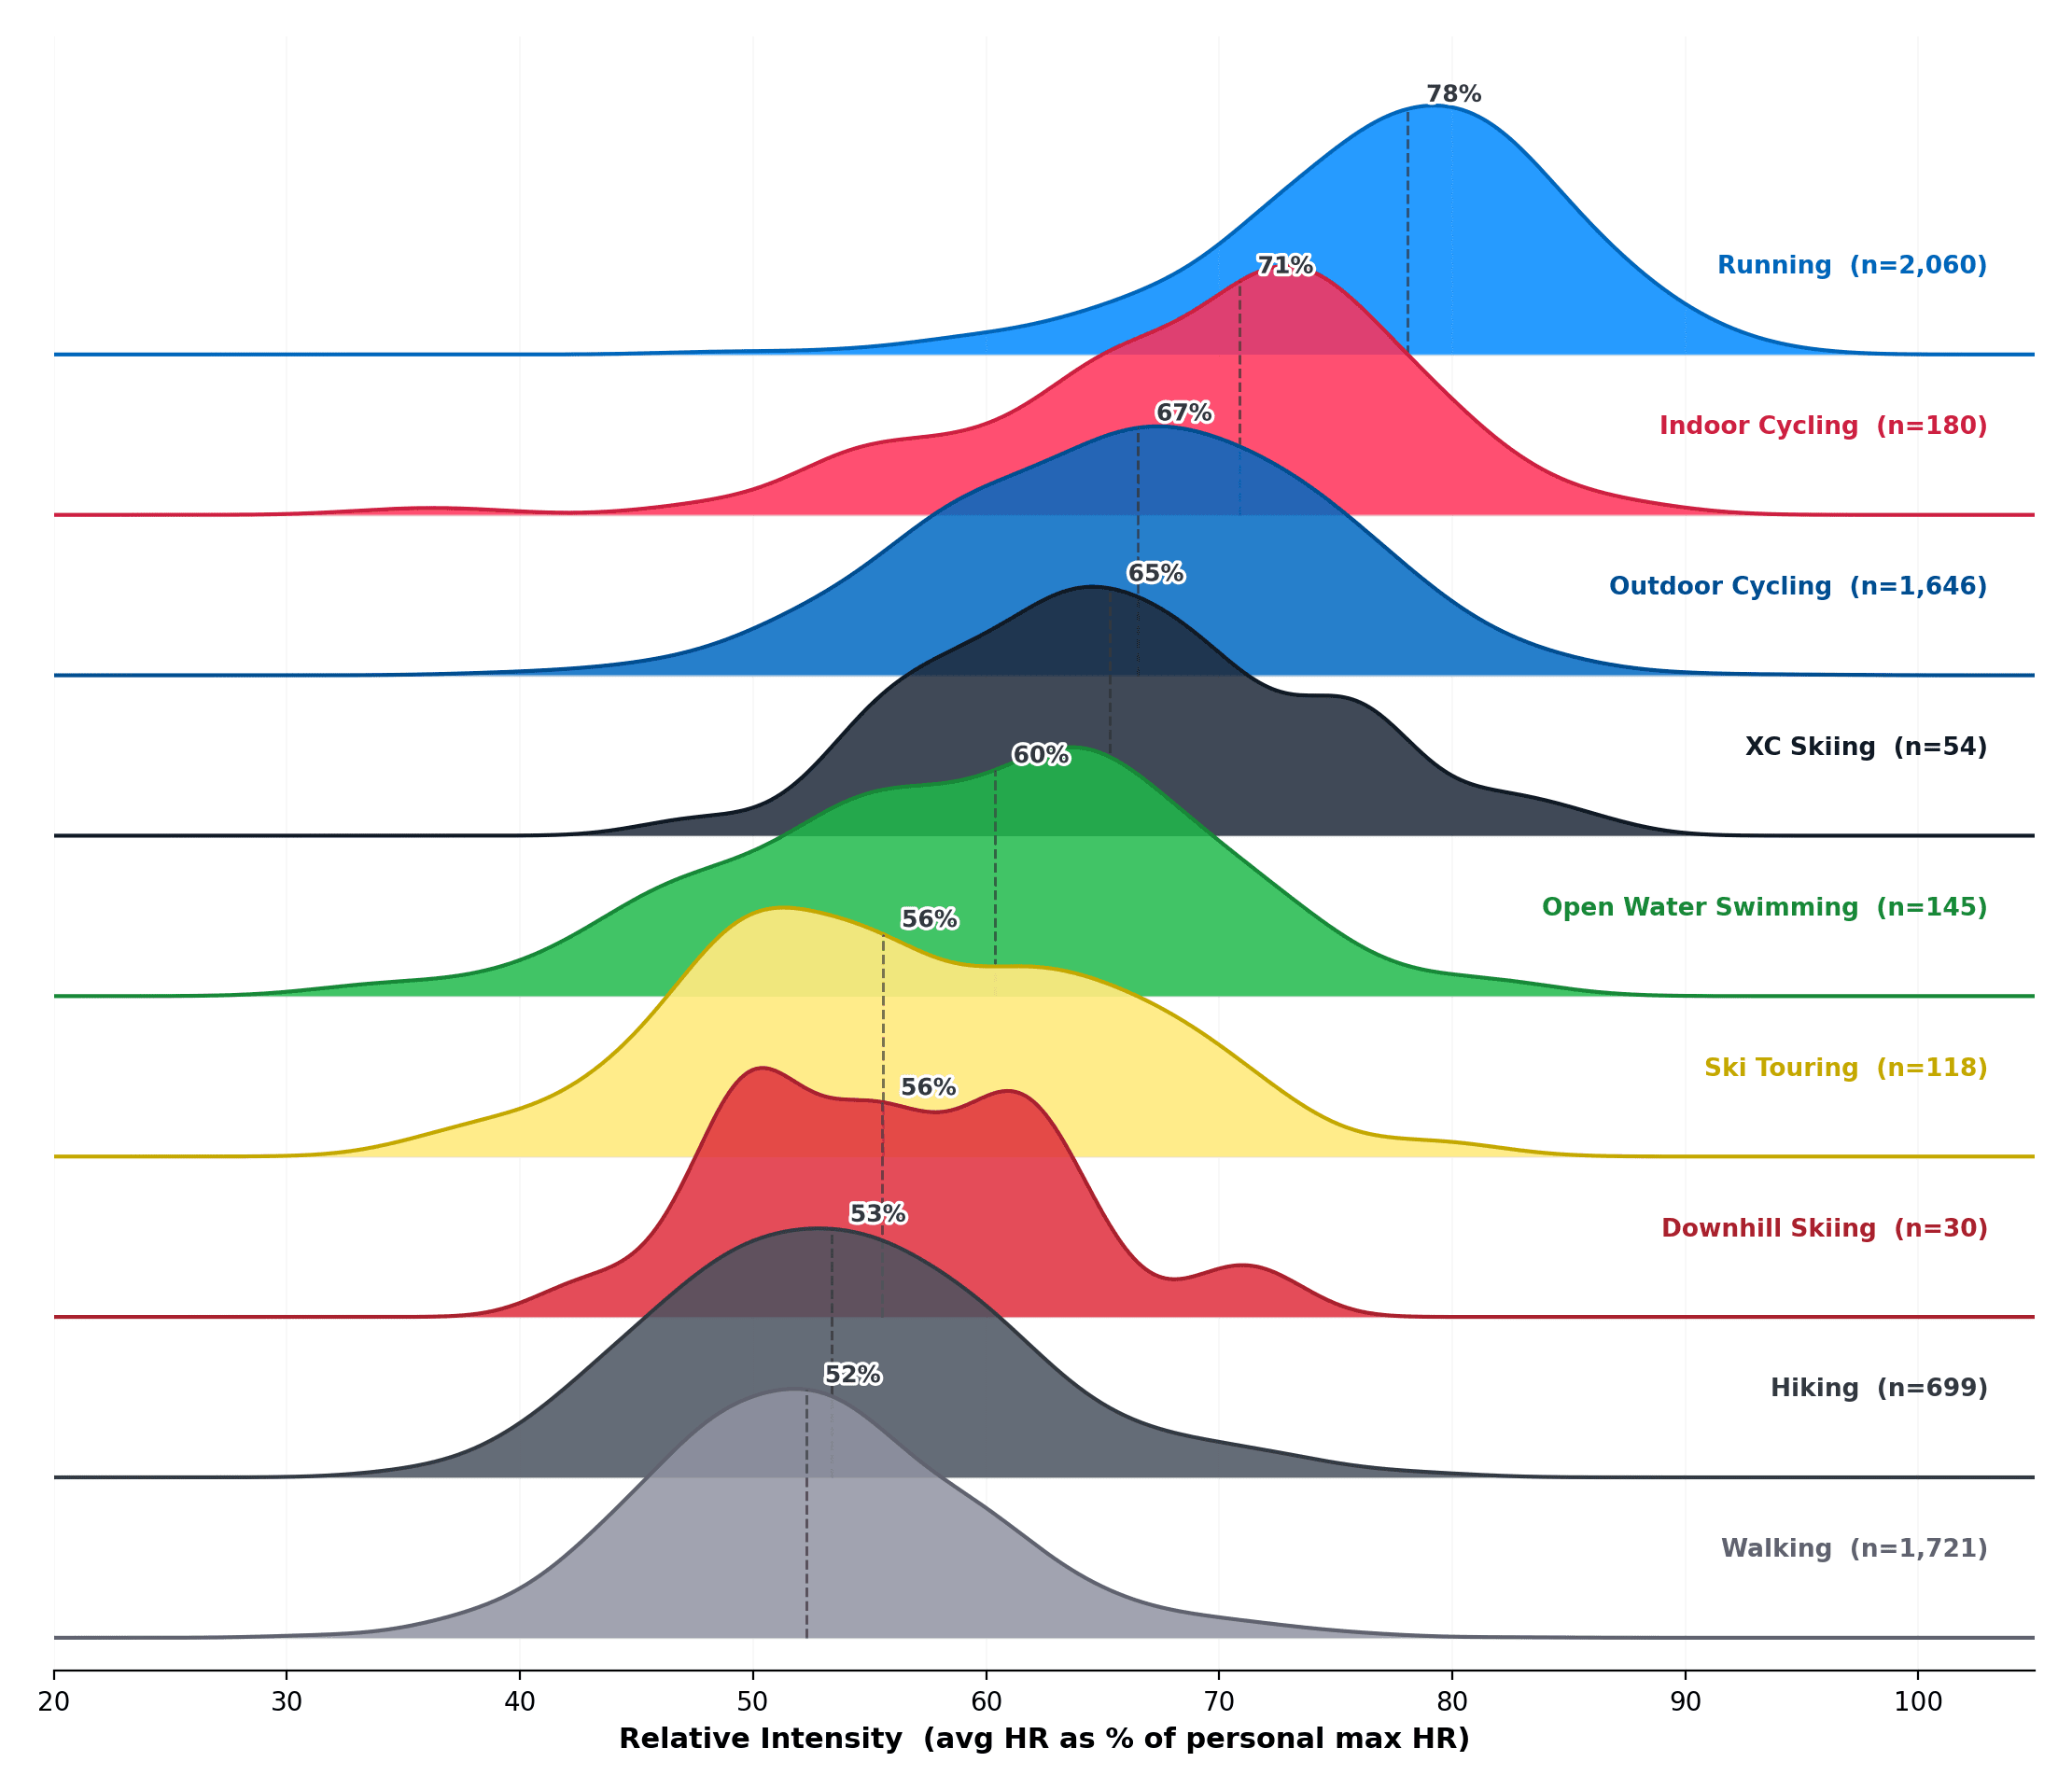
I identified 2,808 multi-sport users who logged at least five sessions in two or more modalities. For each person, we used their highest-ever recorded heart rate as their personal Max HR, then expressed each session's average HR as a percentage of that ceiling. The result is unambiguous. The same individuals who run at a median 78% of their personal Max HR cycle outdoors at just 63%, and walk at 51%. Among the 1,480 users who both run and cycle outdoors, 93% have a higher relative intensity when running, a median gap of 10 percentage points. It's not that runners are fitter than cyclists, it's that running, as a biomechanics act, demands more of the cardiovascular system than cycling does, even in the same body.
I also tested this using the 95th percentile of each user's peak HR rather than the absolute maximum, to exclude potential sensor artefacts. The ranking and gaps were identical.
Figure 4: Within-Person Relative Intensity Ridge. Each user's session average HR is expressed as a percentage of their highest ever recorded heart rate. Even controlling for individual fitness, running sits highest — 93% of runner-cyclists train harder when they run.
But running is mostly shorter — and that changes the picture
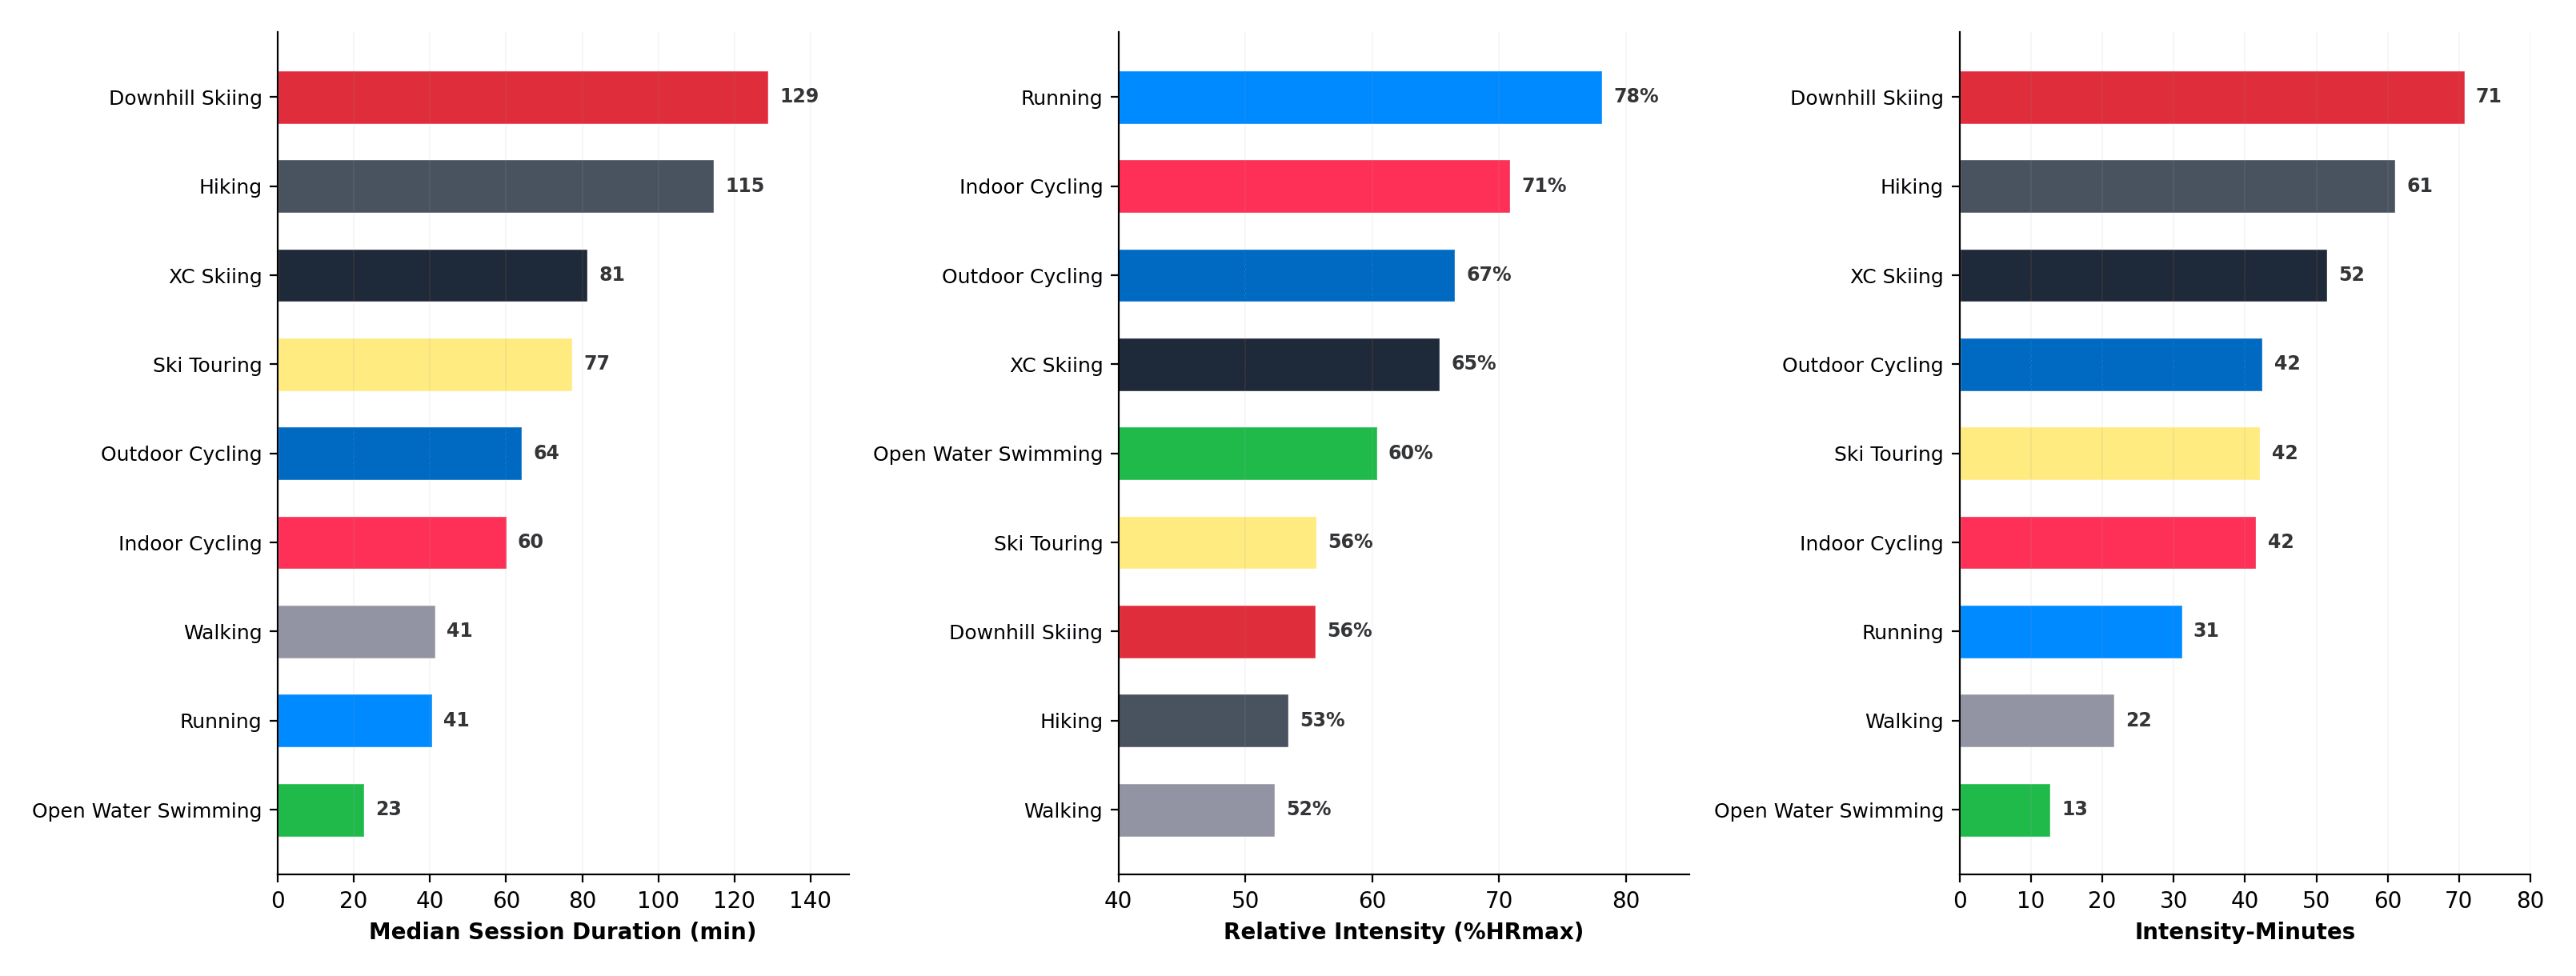
I can already hear people screaming: But running sessions are shorter. Fair point. The median run in this dataset lasts 41 minutes. The median outdoor cycle lasts 64. A hike: 115. Downhill skiing: 129. Running may be the most intense sport per minute, but is it the hardest session overall?
To answer that, we multiplied each session's relative intensity by its duration to create "intensity-minutes" — a single metric that captures total cardiovascular load. A 40-minute run at 78% of max yields 31 intensity minutes. A 64-minute cycle at 67% produces 42.
The rankings flip. Downhill skiing — the least intense per minute — tops the chart at 71 intensity-minutes because sessions last over two hours. Hiking (61) and XC skiing (52) also overtake running (31). Among the 1,480 runner-cyclists, only 39% accumulate more intensity minutes when running than when cycling.
Figure 5: Time-Weighted Intensity (3-panel bars). Running is the most intense sport per minute (B), but shorter sessions mean its total cardiovascular load per session is lower than outdoor cycling, XC skiing, or hiking (C). Intensity-minutes = relative intensity × duration.
So which framing is right? That depends on how you think about intensity, and this is a problem we deal with every day at Terra when building physiological scores.
Intensity isn't linear, and the weighting method changes the answer
Here's the issue with a straight duration × intensity calculation: it treats every beat per minute equally. But going from 110 to 120 bpm is not the same physiological event as going from 160 to 170. Above the lactate threshold, the metabolic cost of exercise rises exponentially, oxygen consumption drifts upward, lactate accumulates faster, and recovery cost per minute increases sharply. A linear model ignores all of this.
So I tested four weighting approaches:
Linear — duration × relative intensity. The naive model.
Exponential — duration × intensity². Squares the intensity term so high HR contributes disproportionately.
TRIMP (Banister, 1991). The academic standard. Uses an exponential function calibrated against blood lactate data: load = duration × HRR × 0.64e^(1.92 × HRR). I estimated resting HR at 60 bpm when individual data weren't available.
Zone-weighted - Assigns escalating multipliers by HR zone (1× below 60%, up to 5.5× above 90%). The consumer-platform approach.
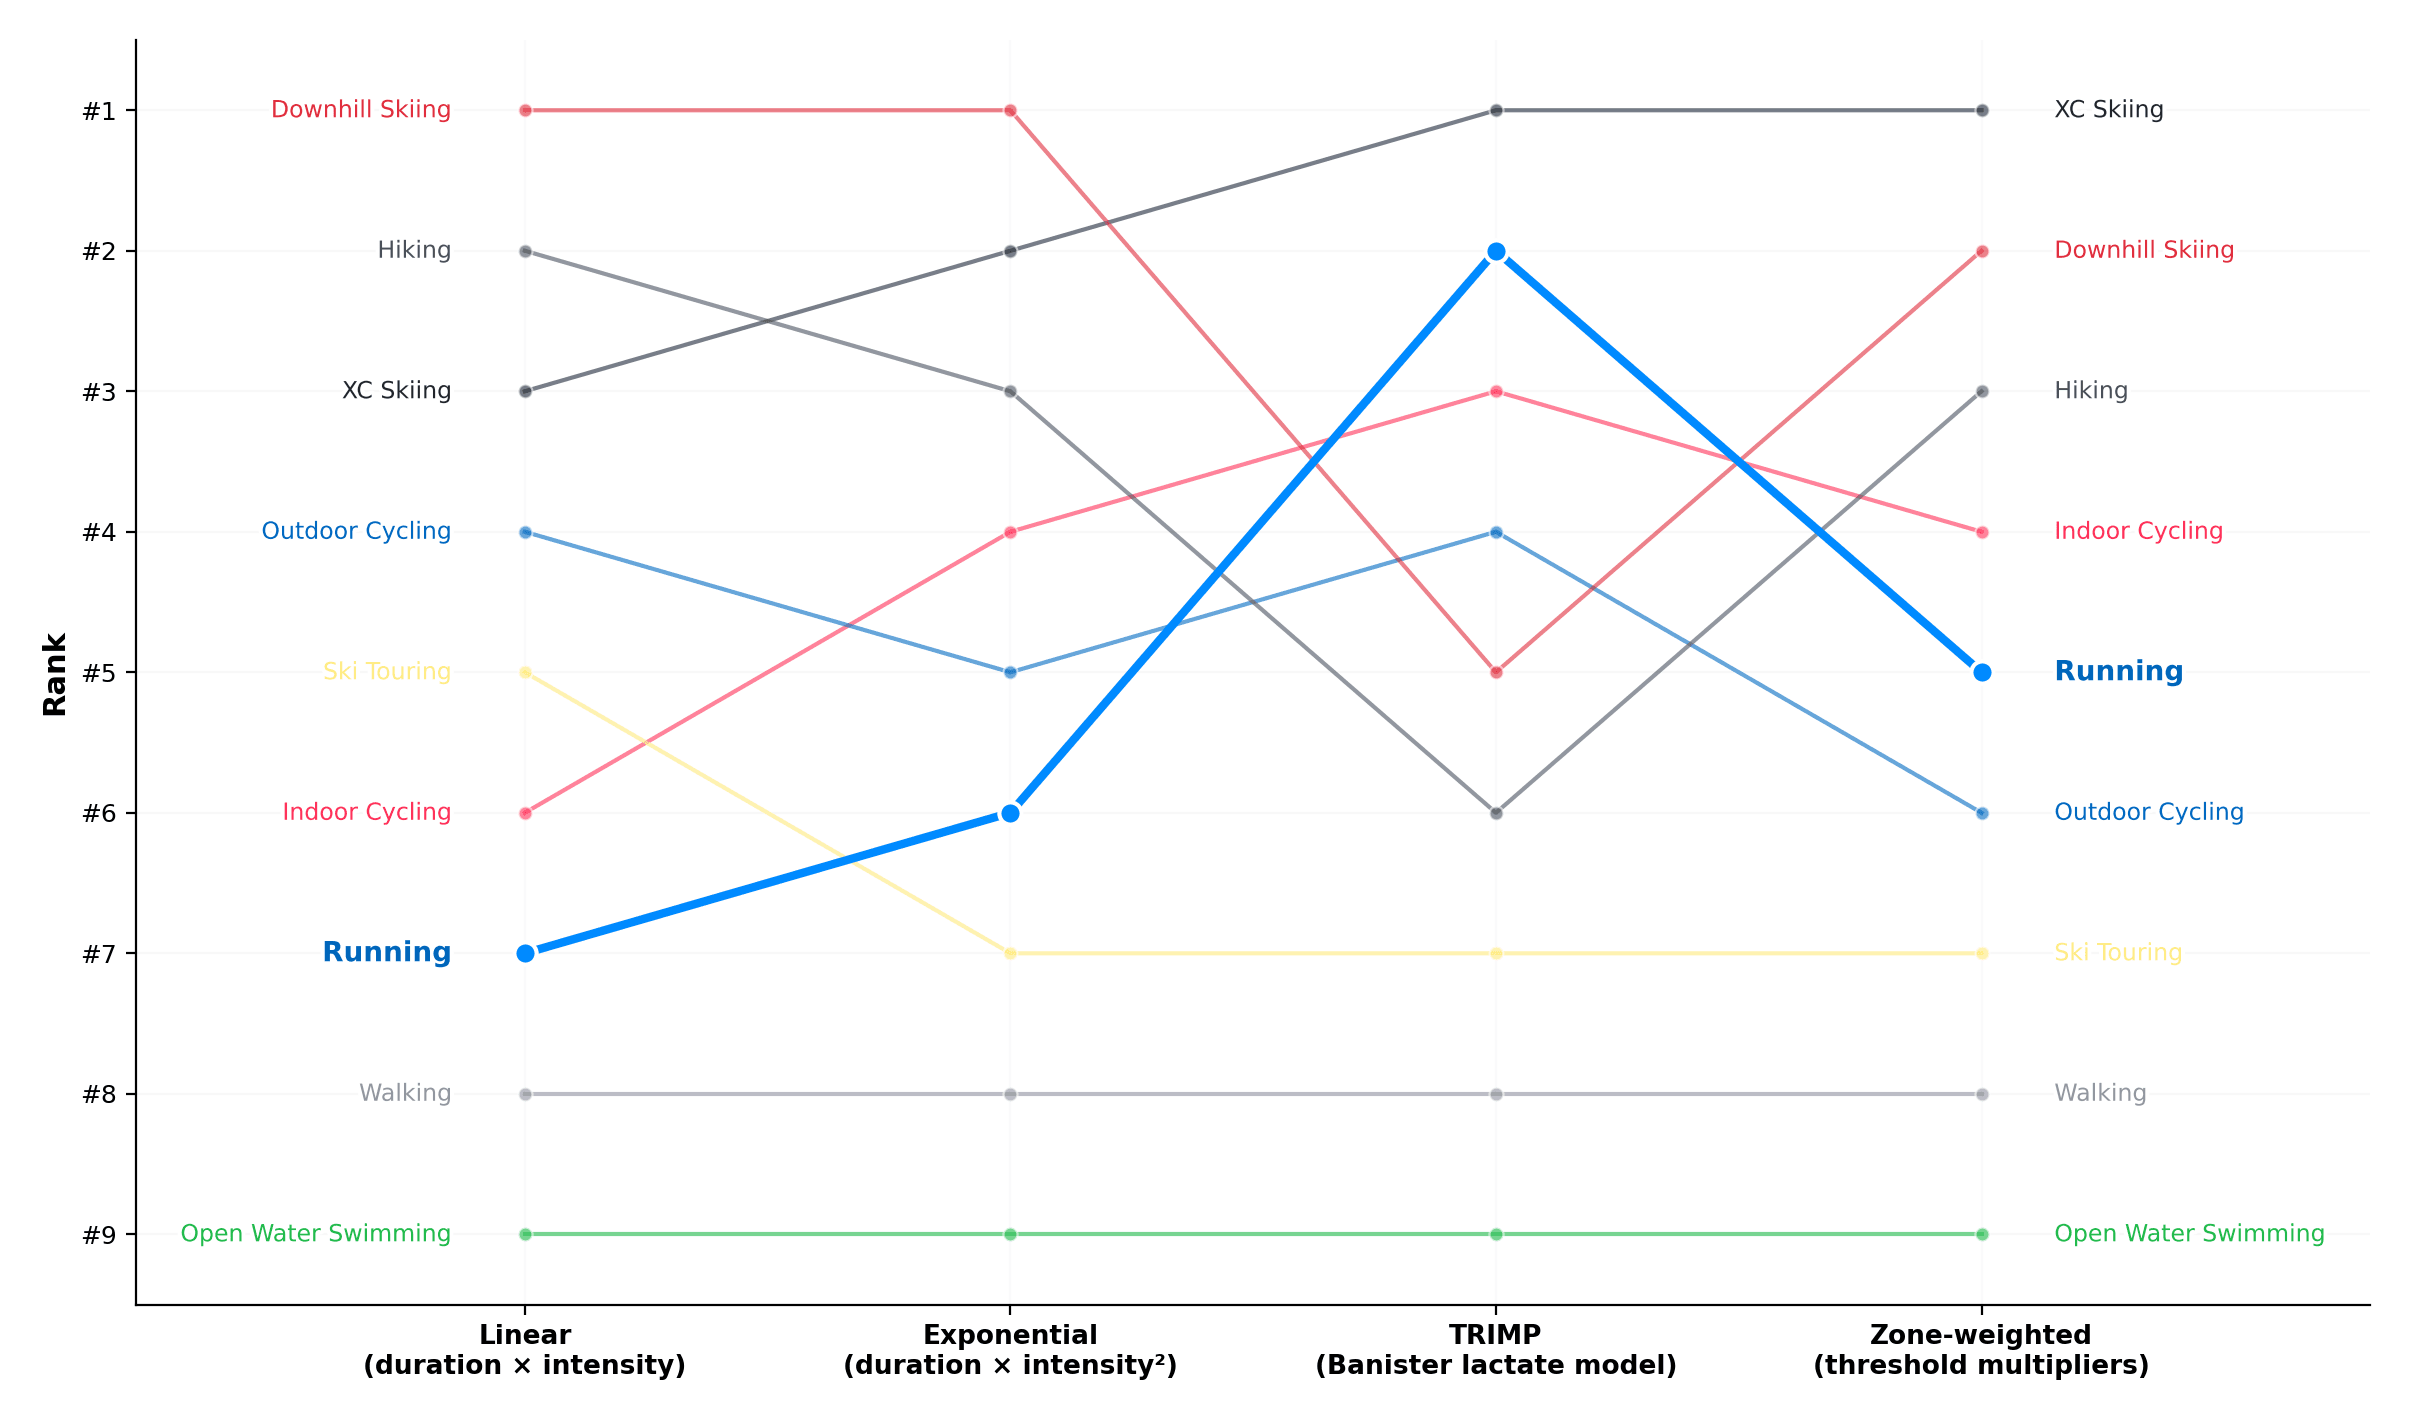
The results are dramatic. Under the linear model, running ranks 7th, duration dominates, and cycling, hiking, and skiing all produce more total load. Apply the exponential weighting, and it climbs to the 6th. But under TRIMP, running jumps to 2nd, behind only XC skiing.
Figure 6: Weighting Method Bump Chart. How you weight intensity changes the answer. Under a linear model, running ranks 7th — duration dominates. Apply the exponential weighting derived from blood lactate data (TRIMP), and running climbs to 2nd, behind only XC skiing.
In the paired runner-cyclist comparison, TRIMP is the only model where running edges ahead (53% of users, median delta +5). The linear model has cycling winning in 61% of users. The exponential narrows the gap to 56-44. TRIMP tips it. The reason is straightforward: running spends more time at high fractions of heart rate reserve, where the TRIMP exponential term amplifies the load. A runner at 78% of HRmax for 41 minutes generates more TRIMP than a cyclist at 63% for 64 minutes, because the exponential penalizes moderate intensity less than it rewards high intensity.
A caveat: TRIMP is designed to be calculated from the full heart rate time series by summing the exponential weighting at every second, not by applying it to a session average. We don't have second-by-second HR in this dataset, only session summaries. Averaging the heart rate before applying the exponential smooths out the spikes, which means I’m likely understating the load for variable sports like XC skiing and outdoor cycling (where those high-HR bursts would contribute disproportionately) and possibly overstating it for steady-state efforts like running. But in data science, you work with the information you have, and the direction of travel across four different models is consistent enough to draw conclusions.
This is exactly the kind of problem we think about at Terra when building training load scores. The model you choose isn't just a technical detail, it determines what the data tells you.
Where our data falls short
We should be transparent about what this analysis cannot tell you. We have no demographic information — no age, sex, or fitness level — so we can't separate these effects from sport selection. We don't know training intent (easy run vs tempo session), which means our distributions blend structured training with casual activity. And the HR data comes from wrist-worn devices, which are less accurate than chest straps, particularly during activities with significant arm movement like swimming and skiing.
References
1. Banister EW, Calvert TW. Planning for future performance: implications for long term training. Can J Appl Sport Sci. 1980;5(3):170–176. https://pubmed.ncbi.nlm.nih.gov/6778623/
2. Kreider RB, Cundiff DE, Hammett JB, Cortes CW, Williams KW, Hill DW, et al. Physiological responses of triathletes to maximal swimming, cycling and running. J Sports Sci. 1986;4(2):155–163. https://pubmed.ncbi.nlm.nih.gov/3821455/
3. Solli GS, Tønnessen E, Sandbakk Ø. Training load quantification in elite swimmers using a modified version of the training impulse method. Int J Sports Physiol Perform. 2017;12(3):373–381. https://pubmed.ncbi.nlm.nih.gov/24942164/
4. Wallace LK, Slattery KM, Impellizzeri FM, Coutts AJ. Establishing the criterion validity and reliability of common methods for quantifying training load. J Strength Cond Res. 2014;28(8):2330–2337. https://pubmed.ncbi.nlm.nih.gov/24662229/
5. La Gerche A, Heidbuchel H. Endurance sport and cardiovascular health: can too much exercise damage the heart? Heart. 2014;100(16):1227–1234. https://pmc.ncbi.nlm.nih.gov/articles/PMC4535361/
Summary questions
Is running really the hardest endurance sport on the cardiovascular system?
Per minute, yes. Running shows the highest median session average HR (145 bpm) and the highest median peak HR (166 bpm) of nine sports analyzed, with a sustained intensity ratio of 87.5%. But once you factor in session duration, running's total cardiovascular load per session drops behind cycling, hiking, and XC skiing — so 'hardest' depends on whether you measure intensity or total load.
Why is my heart rate so much higher on the indoor trainer than outdoors?
Because the turbo eliminates everything that suppresses outdoor HR. Median average HR for indoor cycling is 134 bpm versus 125 bpm outdoors — a full 9 bpm gap — because there's no coasting, no traffic lights, no descents, and no soft-pedaling for fun. Indoor cycling's sustained intensity ratio (86.8%) sits just 0.7 points behind running, making it the purest sustained effort after running itself.
Are runners just fitter, or does running actually demand more from the body?
It's the activity, not the population. In a within-person analysis of 2,808 multi-sport users, the same individuals ran at a median 78% of personal Max HR, cycled outdoors at 63%, and walked at 51%. Among 1,480 users who both run and cycle, 93% hit higher relative intensity when running, with a median 10-percentage-point gap. Same body, harder cardiovascular demand.
If running is so intense, why doesn't it produce the highest training load?
Because runs are short. The median run lasts 41 minutes versus 64 for outdoor cycling, 115 for hiking, and 129 for downhill skiing. When you multiply relative intensity by duration, downhill skiing tops the chart at 71 intensity-minutes and running falls to 31. Only 39% of runner-cyclists accumulate more intensity-minutes from running than cycling.
Does the way you calculate training load actually change which sport wins?
Dramatically. Under a linear duration × intensity model, running ranks 7th of 9 sports. Under exponential weighting it climbs to 6th. Under TRIMP — the lactate-calibrated academic standard — running jumps to 2nd, behind only XC skiing. In paired runner-cyclist comparisons, cycling wins in 61% of users under linear weighting but running wins in 53% under TRIMP. The model you pick determines the answer.
Why does walking show such a 'high' sustained intensity ratio?
It's a statistical illusion. Walking's 86.3% ratio looks comparable to running's 87.5%, but the absolute numbers expose it: median average HR of 98 bpm and median peak of 118 bpm. The ratio is high because there's no variation, not because there's effort. A flat, low-amplitude session produces the same ratio shape as genuinely sustained hard exercise.
Why does cross-country skiing feel so brutal but rank lower on sustained intensity?
Because it's spike-and-glide. XC skiing produces a median peak HR of 163 bpm — virtually tied with running's 166 — but its sustained intensity ratio is only 76.8%, ranking 7th of 9. Explosive hill efforts hit near-maximum, then long gliding recovery phases pull the average back down. It peaks like running but sustains like cycling.
Why does downhill skiing have such a huge gap between peak and average HR?
Because it's the most stop-and-go sport in the dataset. Downhill skiing's median peak HR (149 bpm) rivals outdoor cycling, but its median average is just 102 bpm — a 47 bpm gap that yields the lowest sustained intensity ratio of any sport at 68.3%. Short bursts of explosive effort on the piste are followed by lifts, queues, and standing around in the cold.
Can wearable data really settle debates about which sport is hardest?
Partially. Session-summary HR data from thousands of athletes across nine modalities cleanly separates sports into three intensity tiers and reveals fingerprints invisible to lab studies. But this analysis lacks age, sex, fitness level, and training intent, and uses wrist-worn HR which is less accurate during arm-heavy activities like swimming and skiing. The direction of travel is robust across four weighting models — but the precise ranking depends on the question you're asking.