We use cookies to enhance your browsing experience and analyse our traffic. Nothing beyond essential cookies runs until you choose. You can change your mind any time in our Cookie Policy.
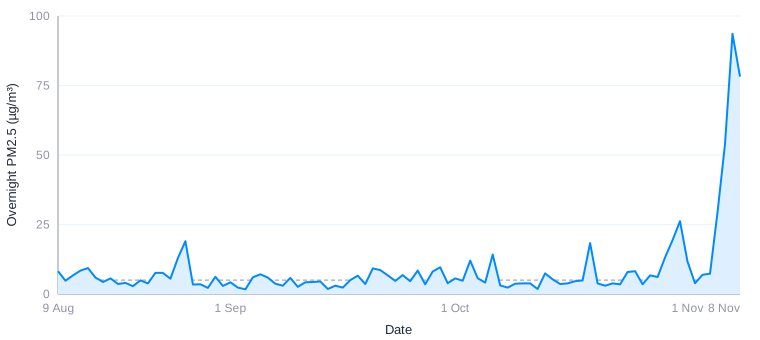
A normal London night in this window was 5 µg/m³ of PM2.5. The night of 7 November was 94!
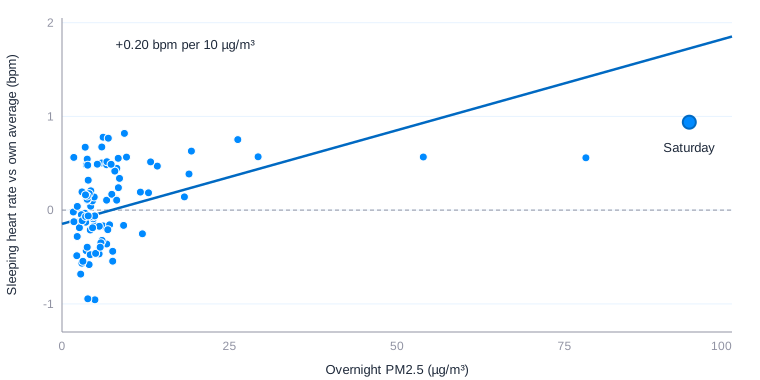
Force one straight line through this data and, for each +10 µg/m³, sleeping heart rate is +0.20 bpm, heart-rate variability (rMSSD) −0.7%, and steps −112.
I analysed the same person on a dirtier night, not different people. It is still there if you drop Bonfire Night. Paris looks similar. Cities whose usual night is already high don’t see much impact.
I spend a lot of time looking at health data, searching for patterns and relationships between heart rate, sleep, training, and more. This analysis started somewhere else. It started with the news. London, on the weekend of 7 November, had some of the worst air of the year. Fog sat on the city, the wind dropped, and the fumes of Bonfire Night couldn't disperse. At 3 am on Monday, Defra's own monitors had 24-hour PM2.5 from the mid-50s up to 138 µg/m³.
Several sites were in the government's high or very high band. A Sunday morning snapshot from IQAir (a Swiss company that ranks cities from government monitors and its own sensors) briefly put London among the ten dirtiest big cities in the world.
I was in Dakar for the Youth Olympic Games that weekend, running through the city centre, and the air felt particularly rough. But it might have just been me. The fine particles were not worse than in London. The model had PM2.5 at about 18 on Friday and 30 on Saturday, against about 32 and 42 on the London monitors. PM10 was the rough bit.
About 32 on Friday, a little under London's 42, then about 65 on Saturday, against 47. And the heat did not help. Well over 30 degrees, against about 10 in London. The feeling and the fine-particle number are not the same thing. Dust, heat and a hard run can all sit in that "rough".
That is not what London usually is. IQAir's average for the city in 2025 was 9.9 µg/m³. Across the three months I looked at, a normal night was 5.
The question was simple. If the air goes from 5 to 94 overnight, does anything move in the physiological data? Sleeping heart rate. Heart-rate variability. Breathing. How long people slept. Whether they still went outside.
In the papers, the usual number is a daily average. The heart-rate variability studies mostly use a 24-hour mean, sometimes the day before and sometimes only a few hours. A peak, the single worst hour, turns up more in heart-attack studies and in the air-quality alerts. I used the nighttime mean, 22:00 to 06:00, because that is when those sleep numbers are recorded.
Each hour is the median of the monitors that were reporting, and the night is the average of those hours. Saturday night was 94. The day was 54. A 24-hour average would have watered the night down with the afternoon. Steps and the resting heart rate across the day sit on the daytime mean, because that is when they happen.
The pollution
Figure 1 shows how severe the conditions were across London, from 9 August to 8 November. The line is measured PM2.5 from the London Air network, the borough monitors Imperial publishes: Honor Oak Park, Barnes Wetlands, Victoria Park, and background sites in Bexley, Enfield and a few other boroughs.
Figure 1. Overnight PM2.5 in London, 9 August to 8 November. Each hour is the median across the monitors that were reporting, then averaged from 22:00 to 06:00. The dashed line is 5 µg/m³.
Take out 5–8 November, and the median night is 5 µg/m³. Then the line goes vertical! Friday night was 54. Saturday night: 94. Sunday evening is still 78, and that last one is only the late evening, because Monday morning hadn’t all landed when I pulled it.
That weekend was nearly 100 µg/m³ more than a normal night. The unit here is per 10 µg/m³, the same one the heart papers use, so the numbers compare.
Figure 2. One straight line, from a usual night out to Saturday. +0.20 bpm of sleeping heart rate per 10 µg/m³.
One straight line through this window is about 0.2 bpm per 10 µg/m³. Saturday was nine lots of 10 above a normal night, so that line says nearly a couple of beats. It is not quite that simple. Most of the rise occurs before the air gets anywhere near 94, and I will come back to the shape.
As you can imagine, there's plenty of literature that already has a view on this, and it is mostly about heart-rate variability. Two meta-analyses of panel studies put a 10 µg/m³ rise in PM2.5 next to roughly a 1% fall in SDNN and a 1.5–2% fall in rMSSD. Unsurprisingly, sleep papers generally find worse sleep in dirtier air, with the size of the effect all over the place depending on how sleep was measured.
Get the latest Terra Research reports and insights every week as soon as they're published.
I kept anyone with at least 13 outdoor workouts inside Greater London between 9 August and 9 November. About one a week. The data are anonymised, so there is no home address. Where someone is, approximately, comes from the workout, and I line that up with the night. That is an assumption, but a fairly safe one.
The sleeping-heart-rate model is 2,237 people and 106,461 nights.
Everything is within the person. I am not comparing a Londoner to a New Yorker. I am comparing someone's Saturday in August with their Saturday in November, after taking out temperature, wind, the day of the week, and how long they trained that day. A cold, still night raises pollution and it can move heart rate on its own. I did not want to give the particles credit for the weather.
What moved
Per +10 µg/m³
95% CI
People
Sleeping heart rate
+0.20 bpm
+0.16 to +0.24
2,237
Resting heart rate, overnight
+0.15 bpm
+0.09 to +0.21
1,604
Resting heart rate, across the day
+0.23 bpm
+0.18 to +0.28
2,872
HRV, rMSSD
−0.7%
−1.2% to −0.2%
866
HRV, SDNN
−0.4%
−0.7% to −0.1%
782
Steps
−112
−147 to −77
3,240
Time asleep
−0.7 min
−1.1 to −0.2
2,212
Breathing rate
+0.007 /min
includes zero
2,136
Sleeping heart rate on that single slope is +0.20 bpm per 10 µg/m³. Minimum heart rate moved with it, +0.18. On the Friday-to-Sunday nights above 40 µg/m³, compared with the same people's other Friday-to-Sunday nights under 12, sleeping heart rate was 1.4 bpm higher (64.7 against 63.3, 892 people).
The line bends
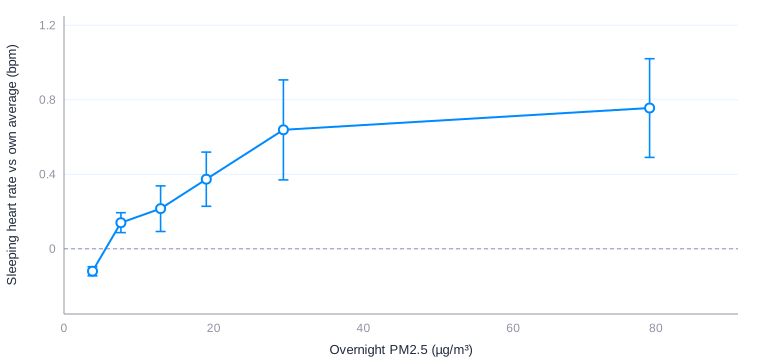
Figure 3. Sleeping heart rate against how dirty the night was. Difference from the same person's average, after temperature, wind, weekday and that day's exercise. The vertical line is the 95% interval. The last three points are a handful of nights.
Below 30 µg/m³, which is all but three of the nights, sleeping heart rate rises about +0.46 bpm per 10. Above 30 the extra slope is about zero, and with only those three nights I cannot tell it from zero. A night around 4 sits 0.12 bpm under that person's own average. A night around 30 sits 0.64 above it. The polluted nights, the ones around 78, sit 0.76 above. So last Saturday is not a new step up from a moderately polluted night. Most of it has already happened by the time the air is in the high 20s. The interval is narrow on the clean nights because that is where almost all the data sit. The higher nights are few, thankfully. With more of them, that top end could move.
Leave 5–8 November out and the single slope goes from +0.20 to +0.51 bpm per 10, because what you have left is the steep bit. rMSSD goes from −0.7% to −1.2%, and SDNN from −0.4% to −2.1%, which is similar to the published literature.
I use steps as a decent bellwether for whether people went out. 112 fewer steps per 10 µg/m³ of that day's PM2.5. On a day that is 50 above a normal one, that is about 500 fewer steps. People went out less. I did not look at whether the runs that still happened were harder. Pace-adjusted heart rate is a different question, and a messier one, as we've discussed in previous posts.
Time asleep also moved, but I trust it less. 0.7 minutes shorter per 10, and about 5 minutes shorter on the offending weekend. Drop 5–8 November and the duration effect goes away. Those nights were fireworks, fog and a weekend. People stay up. Breathing rate never cleared the noise.
Is it just London in November?
I ran the same comparison for three months in eight other cities, same rule of about one outdoor workout a week. The pollution number outside London is a model (CAMS, via Open-Meteo), not a street monitor, so I trust the London slope more than these. The point was to see if the pattern was a one-weekend fluke.
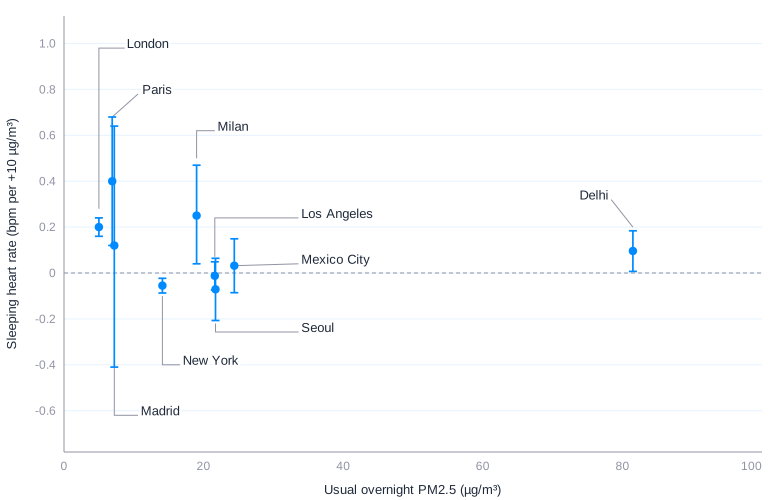
Figure 4 is the same heart-rate slope against a usual overnight PM2.5. Cleaner cities sit on the left. The slope gets smaller as that usual night gets higher.
Figure 4. Sleeping heart rate per +10 µg/m³ against a usual overnight PM2.5. The vertical line is the 95% interval. London is measured by street monitors. The other cities are from an Open-Meteo model, not direct measurements.
The cities near zero are the ones whose usual night is already high, up where London's own curve flattens. Los Angeles, usual night 22, slope about zero. Seoul, 22, flat. Mexico City, 24, flat. Delhi, where a typical night was already 82 and the peak was 175, was +0.10 in 40 people. This makes sense. It is what you would expect if another 10 barely matters once you are already living with that pollution.
Paris has similarly clean air, a usual night of 7, and the slope was the steep one: +0.40 bpm per 10 (230 people). Resting heart rate there was +0.72. Milan still rises, +0.25 in only 41 people. Its usual night is 19, but the cleaner nights still drop to around 9, so much of the contrast is in the steep part.
Madrid and Mexico City did not show a clear heart-rate rise. They did show fewer steps, −566 and −258 per 10.
New York is the one that does not fit with the trend, and it is the biggest sample I have. A usual night there is 14, and the clean nights are about 5, so it covers the same range where London's heart rate rises. Steps fell, −203 per 10 (5,505 people). Sleeping heart rate did not rise. It was 0.06 bpm lower, in 3,658 people. I am not going to explain that away. Over this autumn, on a model rather than street monitors, New York does not reproduce the London heart-rate result.
What I think it means
A more polluted night comes with a higher sleeping heart rate and lower heart-rate variability. Fewer steps happen on a dirtier day. The heart-rate rise mostly comes from the step from a clean night to a moderately dirty one. London's usual night is 5. The weekend got to 94, but the data seem to show the biggest change when pollution was registering in the high 20s. That top end only has a handful of nights to go on, so this could change if we had more data. The people who slept through both the polluted Friday-to-Sunday and a clean one were about a beat and a half higher on the polluted one.
It is an association. The monitors are in specific places, not outside your bedroom window, and the air indoors will have been cleaner than the kerb. The subjects train, and they own a wearable. Within those limits, the data produced a sizeable result. Pollution shows up as a measurable shift in the physiology.
How much does one polluted night actually raise my sleeping heart rate?
About 0.20 bpm per 10 µg/m³ of overnight PM2.5, based on 2,237 people and 106,461 nights in London. On the Bonfire Night weekend, when PM2.5 hit 94 µg/m³ versus a normal 5, people who slept through both a polluted Friday-to-Sunday and a clean one ran 1.4 bpm higher (64.7 vs 63.3 bpm). Resting heart rate across the day moved even more: +0.23 bpm per 10 µg/m³.
Does the damage scale linearly, or is there a tipping point?
It's not linear — the curve bends early. Below 30 µg/m³, sleeping heart rate rises sharply at about +0.46 bpm per 10, but above 30 the extra slope is effectively zero. Most of the physiological hit happens going from a clean night (around 5) to a moderately dirty one (around 30); the jump from 30 to 94 adds surprisingly little on top.
Do people actually move less on polluted days?
Yes, and it's one of the clearest signals in the data. Steps dropped by 112 per 10 µg/m³ of daytime PM2.5, so a day running 50 above normal cost about 500 steps. This behavioural effect showed up across cities too — Madrid lost 566 steps per 10 µg/m³ and New York lost 203 — even where heart-rate effects were weaker.
What happens to my HRV when the air gets bad?
rMSSD fell 0.7% and SDNN fell 0.4% per 10 µg/m³ of overnight PM2.5 in the London cohort. Excluding the extreme 5–8 November weekend, where the curve flattens, the effects sharpen to −1.2% rMSSD and −2.1% SDNN per 10 µg/m³ — right in line with the 1–2% drops reported in published meta-analyses of panel studies.
Does pollution mess with how long I sleep?
Marginally. Time asleep shortened by 0.7 minutes per 10 µg/m³, and about 5 minutes on the Bonfire Night weekend. But drop those November nights and the duration effect disappears — fireworks, fog and a Saturday night out all keep people up, so this one is hard to pin on particles alone.
Why didn't New York show the same heart-rate effect as London?
Honestly, it's the outlier. New York's usual night is 14 µg/m³ with clean nights near 5 — the same range where London's heart rate rises sharply — yet in 3,658 people sleeping heart rate was 0.06 bpm lower, not higher. Steps still fell (−203 per 10 µg/m³ across 5,505 people), so the behavioural signal held, but the cardiac one didn't reproduce on modelled rather than monitored air.
If I already live in a polluted city, does an extra bad day matter?
The data suggest much less. Cities with already-high baseline nights showed flat slopes: Los Angeles (usual 22) near zero, Seoul (22) flat, Mexico City (24) flat, and Delhi — where a typical night was 82 — just +0.10 bpm per 10. Paris, with clean air like London's (usual night 7), showed the steep response: +0.40 bpm sleeping HR and +0.72 bpm resting HR per 10 µg/m³. The cleaner your baseline, the more each extra 10 µg/m³ costs you.
Can wearable data actually detect air pollution effects on the body?
Yes, and at scale. Within-person comparisons across 2,237 Londoners and 106,461 nights picked up sleeping heart rate, resting heart rate, HRV, steps and sleep duration shifts tied to overnight PM2.5, after controlling for temperature, wind, weekday and training load. Only breathing rate stayed buried in the noise — everything else cleared it, confirming that pollution leaves a measurable fingerprint in consumer physiological data.