We use cookies to enhance your browsing experience and analyse our traffic. By clicking “Accept All”, you consent to our use of cookies according to our Cookie Policy. You can change your mind any time by visiting out cookie policy.
Recovery markers drop on the first night at altitude. Across 14,040 travelers, overnight SpO₂ fell 2.67 percentage points below home baseline and HRV dropped 5.47 ms.
Higher elevations hit harder. Trips above 2,500 m showed SpO₂ drops of 5.64 points, nearly five times the drop seen on normal-elevation trips.
Five nights is not enough to recover. SpO₂ was still 1.78 points below baseline on night 5, and resting heart rate kept climbing instead of coming back down.
Athletes travel to high altitude for performance benefits; others have to cope with it to climb mountains, and some of us just have to deal with it because we like to holiday in beautiful places. I used to go on altitude training camps and have climbed mountains. I always struggled with the “thin air”, and it took days to feel better. One holiday took me to the top of Kilimanjaro, and the low air pressure made me so sick I can barely remember standing at the summit!
Am I alone in my terrible ability to cope with low air pressure? This week's analysis gave me the chance to find out. Can we see the physiological signs of altitude show up on a population level in wearable data?
The physiology is straightforward. As elevation increases, the partial pressure of oxygen decreases, so less O₂ crosses from the alveoli into the blood, resulting in lower arterial oxygen saturation. Acutely, that hypoxemia is compensated for by an increase in breathing rate. That ventilatory drive is itself a form of physiological stress, and we would also expect a more sympathetic overnight compensation: higher heart rate and lower HRV. Over a period of a few days, as the body adapts (in a few different ways), those markers should drift back toward baseline. There may also be an increased sleep drive as part of that adaptation. More time asleep to support recovery under hypoxia.
I used wearable data to follow travellers who spent time at low elevation (activity median under 500 m), then moved into altitude inferred from the same day’s GPS activity (median elevation at least 1,000 m). I required a clean within-person baseline: at least seven lowland sleep nights in the 21 days before arrival, plus a 14-day washout after any prior high stay. The result is a large natural experiment: 14,040 users, 20,648 trips, and 50,572 altitude nights. Median trip elevation was about 1,560 m, ski-town and mountain-city altitudes, not Everest Base Camp, which makes the signals more relevant to ordinary travel than extreme expedition physiology alone.
Methodology
A bit more detail on the method. I filtered for sustained altitude stays rather than all trips. A trip must have same-day high-elevation GPS activity (≥1,000 m) on day 0 and high activity on 1 in 3 days through day 5. That hopefully filters out users who drove up the mountain to exercise and then returned to lower elevations to sleep.
I was concerned about whether I should use day 0 or day 1 as the first night at altitude. Many people may travel to a location, sleep and exercise for the first time the next day. As a sensitivity check, I re-indexed the analysis so that day 1 = the first high-elevation activity (with the prior night presumed already at altitude), and it yielded similar SpO₂ and autonomic curves. Many of the recorded activities in these datasets are short work that devices automatically pick up and record. So an activity doesn’t have to be a “proper” exercise session. I decided to go with requiring high activity on day 0, which has the benfit that we can be fairly confident users are sleeping at high locations.
On the first altitude night, the average person in this cohort differs from their home baseline in several ways. Overnight SpO₂ and autonomic markers move in the expected hypoxic direction (HR up, HRV down), while sleep duration slightly increases. That small increase in sleep drive could be partly physiological (adaptation under hypoxia), but it could also be environmental: places at altitude are often quieter, closer to nature, and darker at night, all of which help sleep.
Recovery by days since arrival
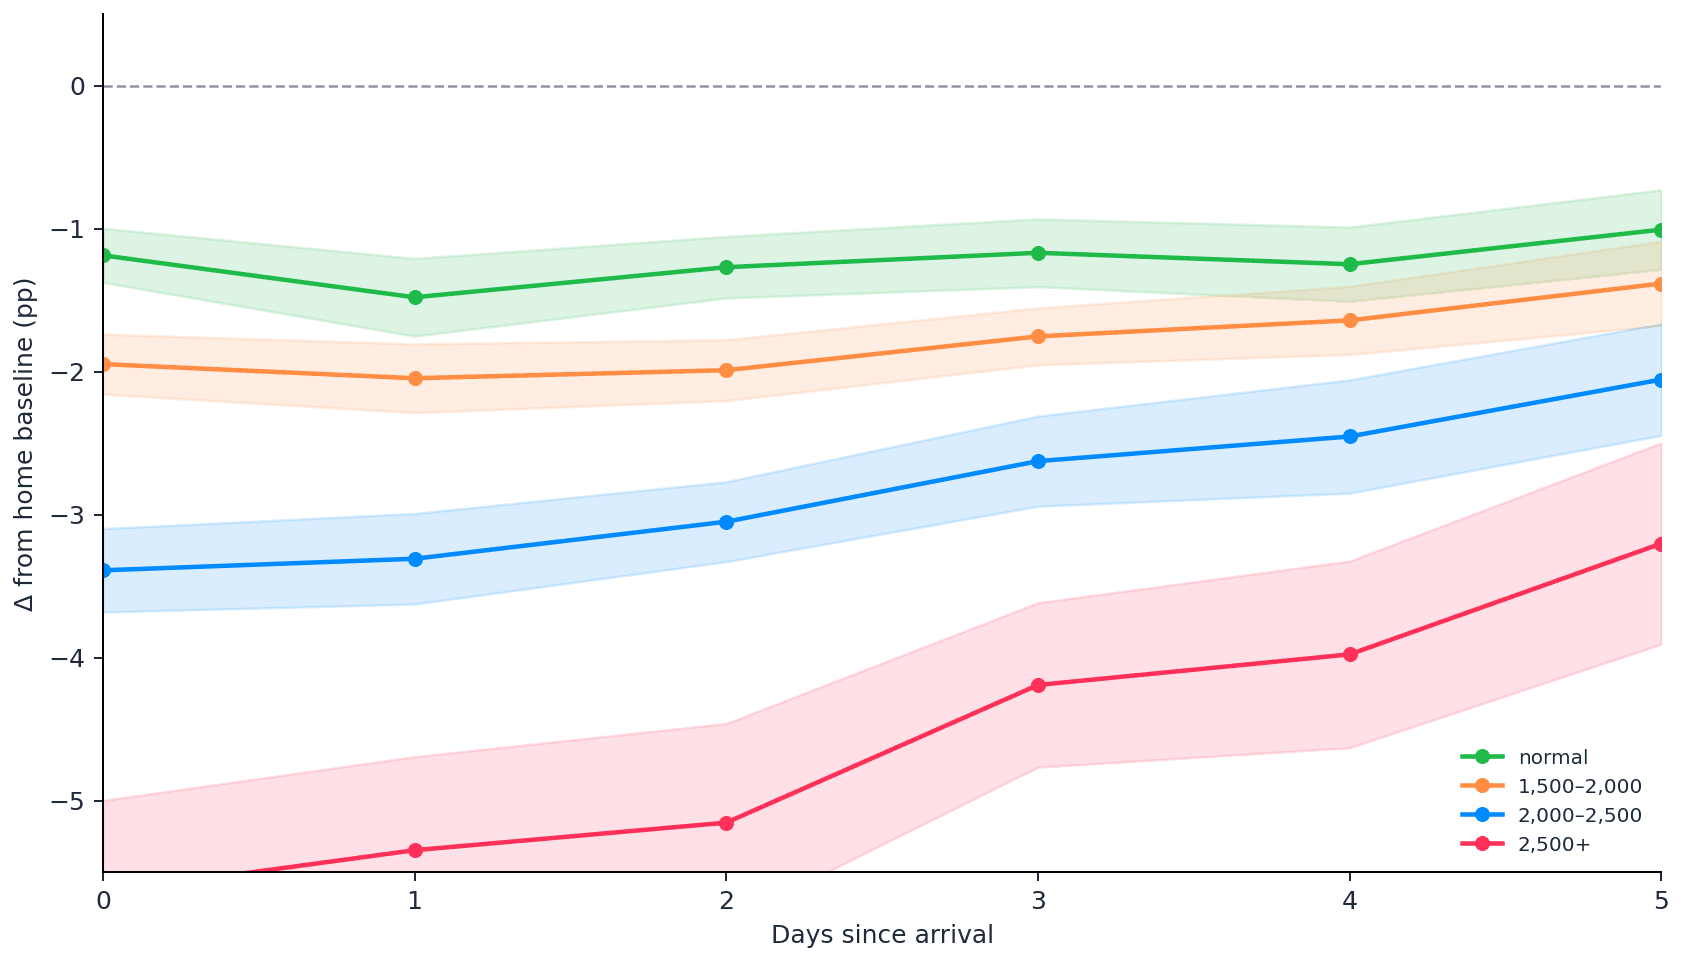
Chart 1: Within-person change in overnight SpO₂ from each traveller’s lowland home baseline, by trip elevation band (sustained cohort). Day 0 is the first altitude night with same-day high activity; ribbons are 95% CIs.
While travelers remained at elevation, several markers moved partially back towards their low-elevation baselines. Mean SpO₂ improved from 2.67 percentage points below baseline on night 0 to 1.78 points below baseline on day 5.
Sleep minimum heart rate and HRV also partially rebounded, although device-derived resting heart rate did not show the same pattern. I think the interesting point here is not that oxygen saturation failed to “normalize”; a lower value is expected while the hypoxic exposure continues, but that mean SpO₂ remained clearly below the low-elevation baseline after five nights.
Table 1. Arrival-night change vs home baseline (sustained 5-day cohort)
Metric
Day-0 Δ
Day 3
Day 5
SpO₂ (pp)
−2.67
−2.18
−1.78
Sleep min HR (bpm)
+2.86
+2.39
+1.96
HRV RMSSD (ms)
−5.47
−3.28
−2.69
Resting HR (bpm)
+1.88
+2.15
+2.28
Sleep duration (h)
+0.14
+0.10
+0.04
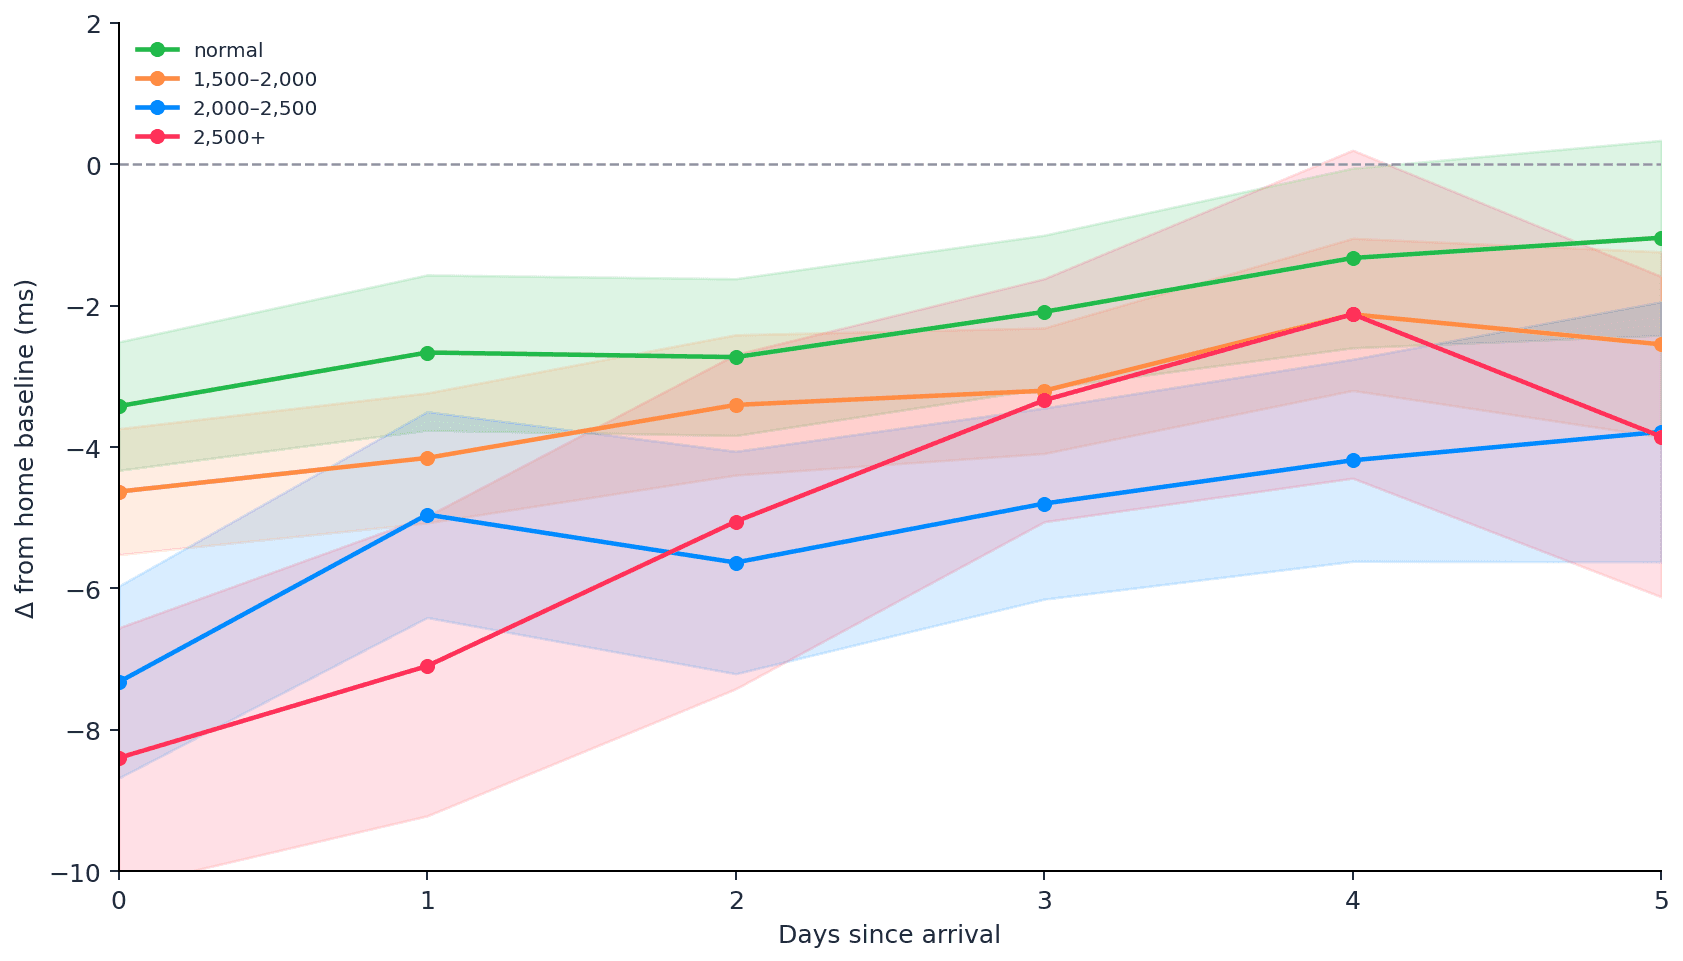
Chart 2: Within-person change in overnight HRV RMSSD from each traveler’s lowland home baseline, by trip elevation band. Day 0 is the first altitude night with same-day high activity; ribbons are 95% CIs.
Dose response by elevation band
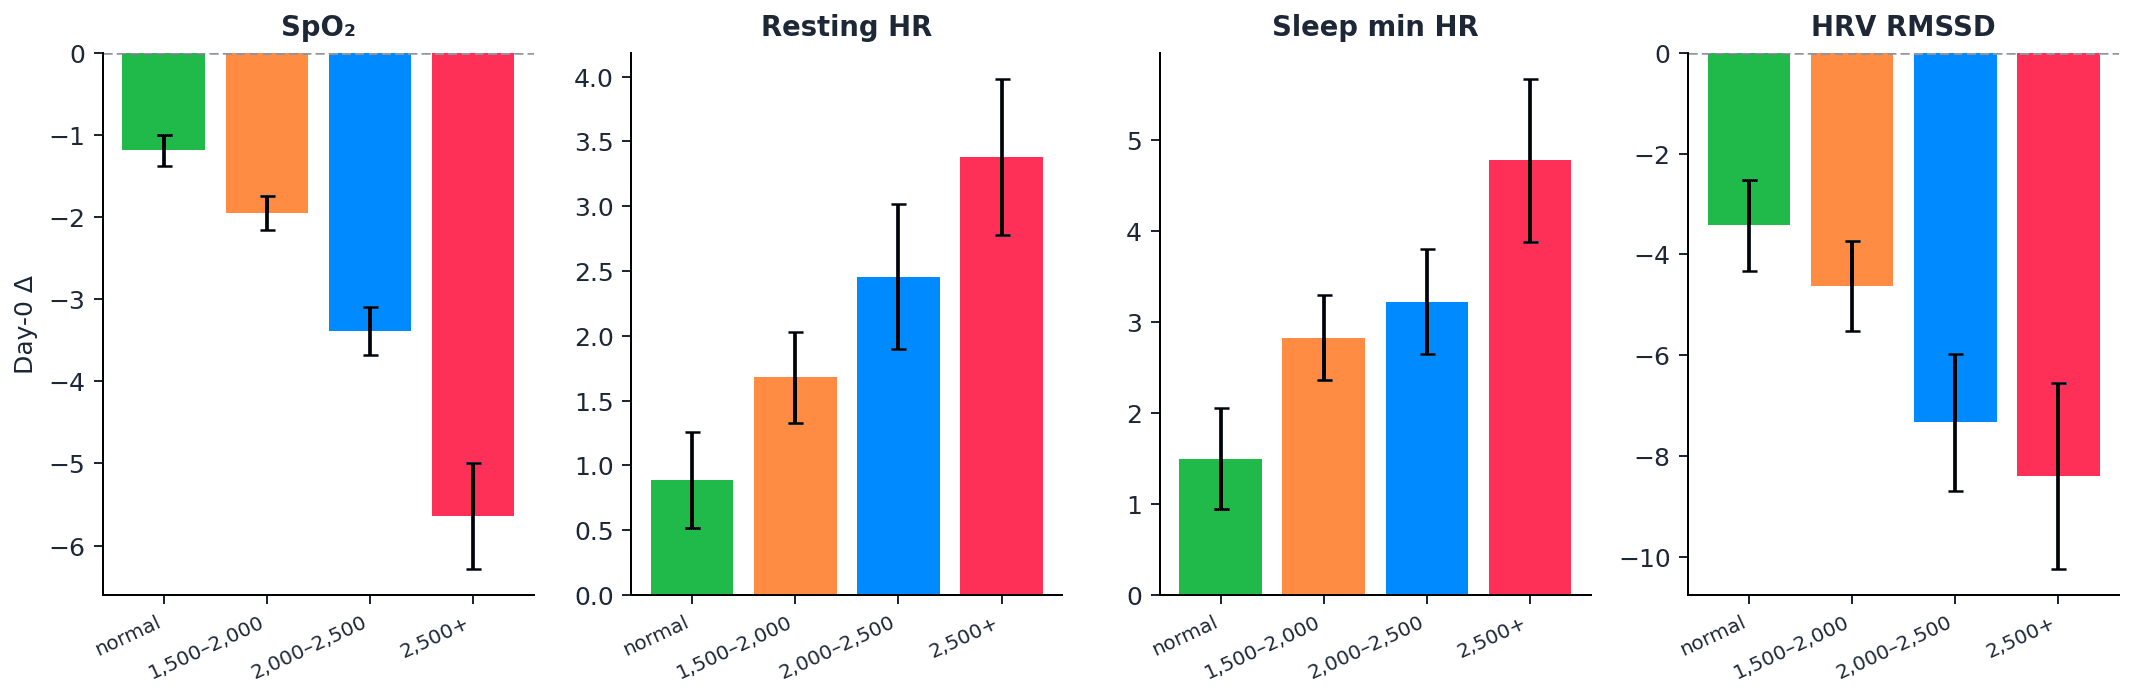
Chart 3: Mean arrival-night change from home baseline for SpO₂, resting HR, min HR, and HRV across elevation bands in the sustained cohort; error bars are 95% CIs.
The changes are not one-size-fits-all. When I stratified trips by elevation, a clear dose response appeared: higher bands show larger SpO₂ drops and stronger autonomic impacts. That gradient is hard to explain by other factors, such as jet lag or hotel beds alone. Travel disruption should not present such a clear relationship with meters gained. Hypoxia should. Guidance tells us that ascent rate and absolute elevation as core risk modifiers for acute altitude illness; these wearable curves show the same dose logic in nightly SpO₂ and autonomic markers.
Table 2. Day-0 Δ by trip elevation band (sustained cohort)
Metric
normal
1,500–2,000
2,000–2,500
2,500+
SpO₂ (pp)
−1.19
−1.95
−3.39
−5.64
Sleep min HR (bpm)
+1.50
+2.83
+3.22
+4.78
HRV RMSSD (ms)
−3.42
−4.63
−7.33
−8.40
Resting HR (bpm)
+0.89
+1.68
+2.46
+3.38
The increase in resting HR across days 0-5 is an interesting and unexpected finding. The simplest explanation is that even while SpO₂ and HRV are starting to partially recover, people in this cohort are still under a higher sympathetic “recovery demand” because the inclusion rule keeps them doing high-elevation activity through days 3–5 (so they are exercising a lot!), and altitude itself can keep sleep physiology disrupted in a way that shifts the wearable’s resting HR estimate upward.
The pattern is consistent with incomplete acclimatization plus residual load from ongoing activity at elevation. It may also be a quirk in how resting HR is calculated by different providers, and how it is impacted by (relatively) high values. Disrupted sleep would drive more and higher HR episodes during the night, pulling resting HR depending on how it’s derived.
5. SpO₂ Δ distributions by day (≥2,000 m)
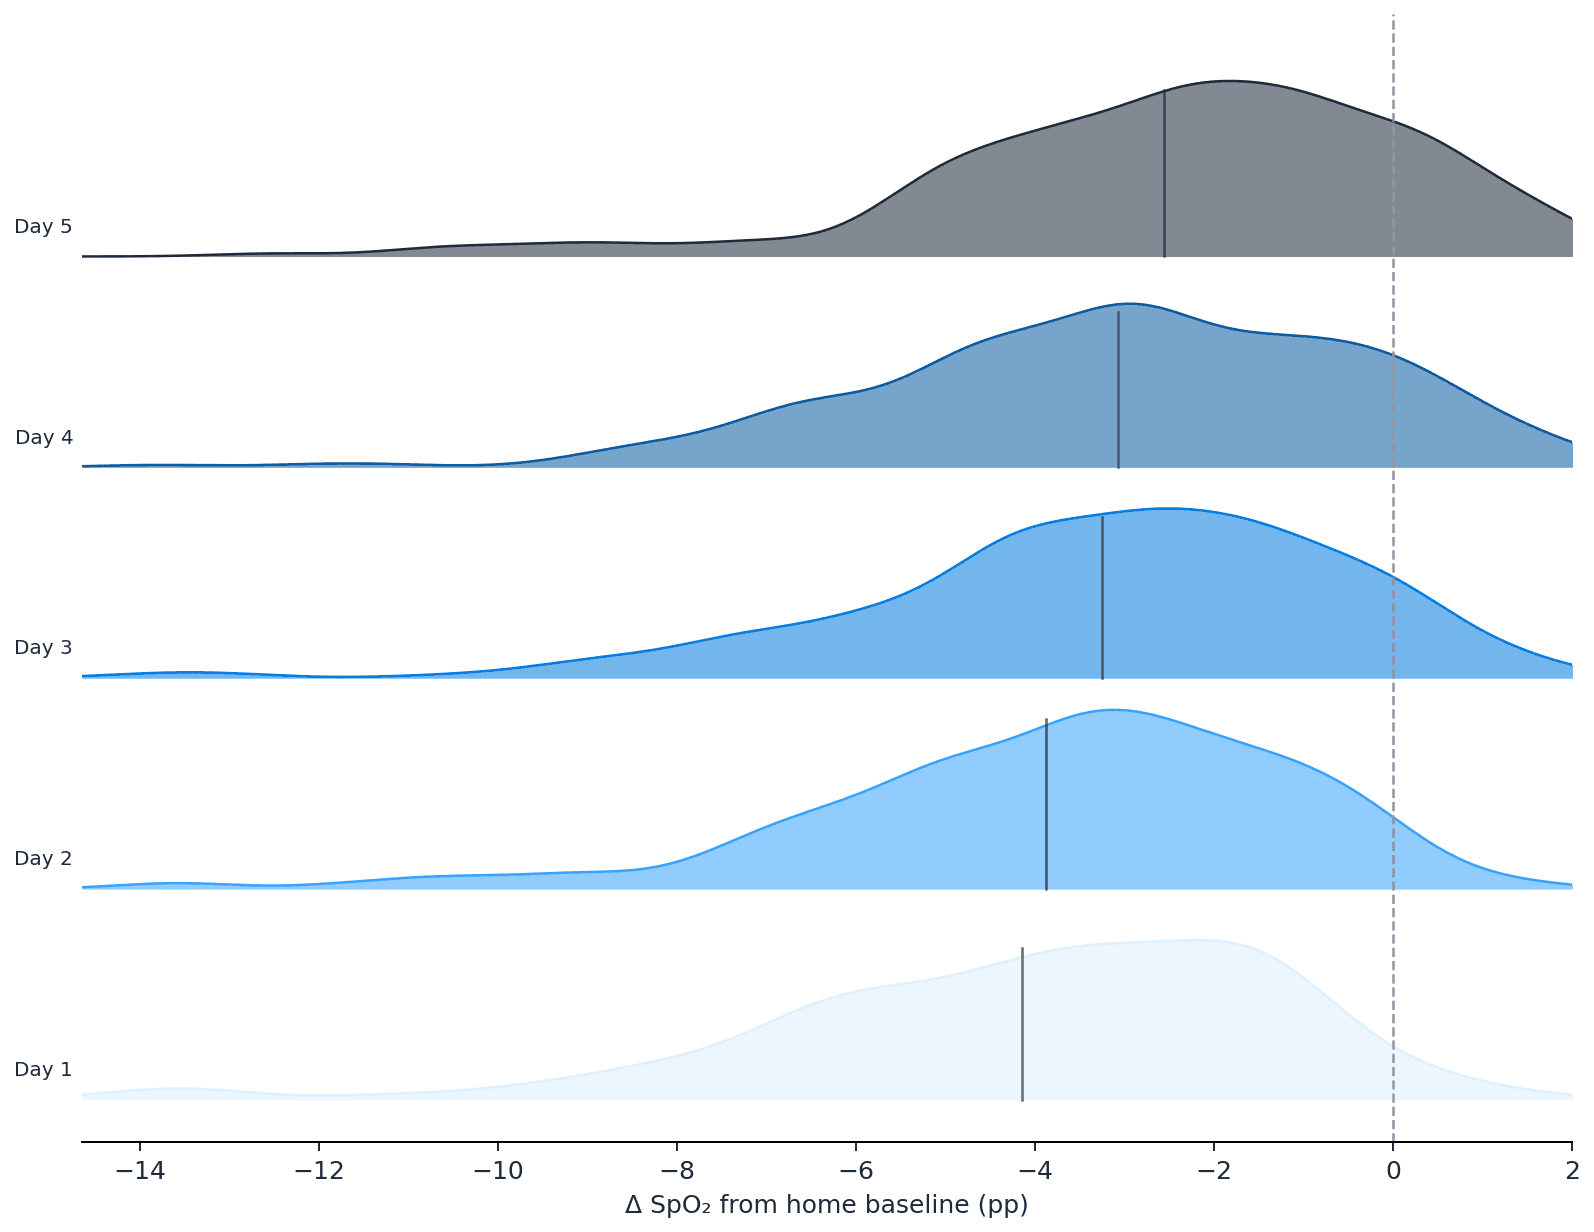
Chart 4: Ridgeline distributions of within-person Δ SpO₂ for days 1–5 among sustained trips ≥2,000 m. Each ridge is a day’s distribution; the vertical tick is the day mean and the dashed line is home baseline.
The distribution view reinforces the mean curves. From day 1 onward among trips ≥2,000 m, the full SpO₂ distribution sits below home baseline, and the mean is not only driven by a few extreme responders.
Means drift only slightly across days 1–5 while travelers remain at altitude, suggesting sustained rather than rapidly resolving desaturation. Richalet’s work on physiological risk factors for severe high-altitude illness also underscores that individual ventilatory and oxygen responses vary widely; these ridge-lines make that heterogeneity visible.
Get the latest Terra Research reports and insights every week as soon as they're published.
For product and coaching contexts, I think there are three practical takeaways. First, expect an acute overnight SpO₂ and autonomic hit when users ascend, even at moderate ski-resort elevations. Second, expect the size of that hit to track elevation. Third, do not treat day-3 HRV recovery as proof that overnight oxygenation is back to baseline; SpO₂ often lags. None of this replaces medical altitude guidance but it shows that consumer wearables already capture the early physiological signature of ascent at population scale.
So it’s not just me; altitude is not a niche edge case in nightly data. It is a measurable environmental exposure that reshapes SpO₂, heart rate, and HRV for days after arrival, in the same devices people use to judge how recovered they are. Next time I’m going to look at individual differences in response, because my experience is that different people respond very differently and it’s tricky to predict.
Luks AM, Auerbach PS, Freer L, et al. Wilderness Medical Society clinical practice guidelines for the prevention and treatment of acute altitude illness: 2019 update. Wilderness Environ Med. 2019;30(4S):S3-S18. https://doi.org/10.1016/j.wem.2019.04.006
Richalet JP, Larmignat P, Poitrine E, Letournel M, Canouï-Poitrine F. Physiological risk factors for severe high-altitude illness. Am J Respir Crit Care Med. 2012;185(2):192-198. https://doi.org/10.1164/rccm.201108-1396OC
How much does my overnight SpO₂ actually drop when I travel to altitude?
On the first altitude night, average overnight SpO₂ was 2.67 percentage points below each traveler's lowland baseline across 14,040 users and 20,648 trips. The drop is dose-dependent: normal-elevation trips saw a 1.19 pp decline, 2,000–2,500 m trips dropped 3.39 pp, and trips above 2,500 m dropped 5.64 pp on arrival night. Even at moderate ski-town elevations around 1,560 m (the median), the desaturation is clearly measurable.
Does my body fully acclimatize after a few days at altitude?
Not by day 5. Mean SpO₂ improved only from −2.67 pp on arrival to −1.78 pp by day 5 — still clearly below baseline. HRV RMSSD partially recovered from −5.47 ms to −2.69 ms, but resting heart rate actually drifted further upward, from +1.88 bpm on day 0 to +2.28 bpm on day 5. Partial rebound, not full recovery.
Why does my HRV bounce back faster than my oxygen levels at altitude?
HRV and heart rate are autonomic responses that adapt as your body adjusts to sustained hypoxic stress, while SpO₂ reflects the ongoing environmental reality of lower partial pressure of oxygen — which doesn't change until you descend. In this cohort, HRV recovered roughly half of its arrival-night deficit by day 5, while SpO₂ distributions still sat entirely below home baseline. Don't treat a day-3 HRV rebound as proof that oxygenation has normalized.
Does altitude affect me more the higher I go?
Yes, and the dose response is clean. SpO₂ drops scaled from −1.19 pp at normal elevations to −5.64 pp above 2,500 m, HRV RMSSD dropped from −3.42 ms to −8.40 ms across the same bands, and sleep minimum HR climbed from +1.50 to +4.78 bpm. The gradient tracks meters gained too tightly to be explained by jet lag or unfamiliar beds — this is hypoxia.
Can consumer wearables actually detect altitude exposure?
Yes, at population scale. Across 50,572 altitude nights, wearables captured the expected hypoxic signature: SpO₂ down, heart rate up, HRV down, with dose-response curves that match published altitude physiology from Bärtsch, Richalet, and Wilderness Medical Society guidance. Altitude isn't a niche edge case in nightly data — it's a measurable environmental exposure that reshapes recovery metrics for days.
Do I actually sleep more at altitude?
Slightly. Sleep duration increased by about 0.14 hours on the first altitude night, tapering to +0.04 hours by day 5. The bump could reflect a physiological adaptation drive under hypoxia, but it's also plausibly environmental — altitude destinations tend to be quieter, darker, and closer to nature. The effect is real but small compared to the autonomic and SpO₂ shifts.
Why is my resting heart rate still elevated days into an altitude trip?
Counterintuitively, resting HR climbed from +1.88 bpm on arrival to +2.28 bpm by day 5, even as SpO₂ and HRV partially recovered. The likely explanation is ongoing sympathetic load — the cohort was still doing high-elevation activity through days 3–5 — combined with disrupted altitude sleep that pulls device-derived resting HR upward. Incomplete acclimatization plus residual training load, not a device error.
Is the altitude effect just a few sensitive people skewing the average?
No. Ridgeline distributions for trips above 2,000 m show the entire SpO₂ distribution sits below home baseline from day 1 onward — not just a tail of extreme responders. That said, individual variability is real and wide, consistent with Richalet's work on ventilatory response heterogeneity. Almost everyone desaturates at altitude; how much varies substantially by person.