We use cookies to enhance your browsing experience and analyse our traffic. By clicking “Accept All”, you consent to our use of cookies according to our Cookie Policy. You can change your mind any time by visiting out cookie policy.
Walking is the most weather-sensitive activity in London. Each extra degree of heat cut walking odds by about 2%, and on the hottest days only 15% of users walked compared to 24% on a typical day.
Rain stops cyclists, but barely affects runners or walkers. Cycling days dropped 14% on rainy days, while running and walking showed no significant rain effect at all.
Hot days push the morning run earlier. On hot days (≥24°C), the morning running peak moved from 8am to 6am, with activity in the 7–8am window noticeably lower than on cooler days.
British people love to talk about the weather. It’s a bit of a cliche, but true and high temps in London just hit differently. Yes, I know it’s more humid than most of its European cousins, and there’s much debate about whether it’s to do with the type of buildings, traffic, pollution, or green spaces. All very important, but I’m interested in what actually happens. When it’s hot in London, do people exercise more, or less?
May 2026 offers a good window to study this, with a fairly wide range of conditions. The coldest morning was 12 May (daily min 4.2°C, max 15.4°C): on that day, 3.4% of our 1,695 May-active users went for an outdoor run, 3.6% cycled, and 27.4% walked, all above their May averages (2.5%, 2.4%, and 19.1%).
The hottest day was 26 May (daily max 34.5°C, min 21.1°C): only 1.9% ran, and 17.4% walked (below May averages), while 3.4% cycled (slightly above average). These data point to what we’d expect, fewer runners and walkers than usual on the hottest days, while the coldest min-temperature day sits closer to the monthly average. Cold in May is not that cold, so we don’t see it impacting activity.
These stats are taken from an activity dataset comprising 20,044 outdoor sessions (16,480 walks, 2,100 cycles, and 1,464 runs). On a typical calendar day, the chance of at least one outdoor session for a user was about 19% for walking, 2.5% for running, and 2.4% for cycling. Those low run and cycle numbers are why I decided to focus on whether people went out at all, not on huge swings in daily totals.
Method
I used this dataset and Open-Meteo weather data, retrieved from their API. To standardize the data set, I selected a sample of users who were active in the dataset before May and logged at least one activity in May. It may sound like a simple problem: find a relationship between temperature and activity in London. But simple population tasks like this are difficult because the user base in these samples is constantly changing.
User A signs up before May and stops exercising on May 5th, while user B signs up on May 6th and never logs a session. This is further complicated if a subset of the sample comes from a wave of sign-ups. If you only count sessions on hot days vs cold days, you’re mixing two things: the weather and who is in the data. A fair comparison keeps the users constant and varies the calendar day.
For each person, I include every day in May and ask whether they did that activity that day. That way, a hot Tuesday is compared to a mild Tuesday for the same 1,695 people, not a growing crowd in May vs a smaller one in March. P(active that day) is the share of those person-days with at least one start; it’s the fairest method I could come up with to determine “are people more or less likely to go out?” when sample size and user mix would otherwise skew the story. (It doesn’t measure how long or hard they trained, only whether they went out.)
For each user and each calendar day, I mark yes if they started at least one outdoor session of that type; otherwise, no. About 2.5% for running means roughly one outdoor run day in every 40 calendar days for a typical user in the sample. I also ran logistic regressions on the same user–days: temperature or rain, plus day-of-week controls, with errors clustered at the user level. Those models back up the heat/rain claims. The line charts below are easier to read and don’t automatically adjust for weekdays.
Get the latest Terra Research reports and insights every week as soon as they're published.
For temperature, each extra 1°C on the day’s maximum was linked to slightly lower odds of going out: walking showed the strongest effect (odds ratio 0.98 per °C, highly significant), running a similar but smaller significant effect (0.98, p ≈ 0.0002), while cycling showed no clear daily temperature relationship (OR 1.00, not significant). Results were similar using the day’s minimum temperature instead of the max.
Quick notes on odds ratio: Any number below 1 means that the thing is less likely to happen, and anything above 1 means it’s more likely to happen. Here, 0.98 means a person is about 2% less likely to go for a walk for each 1-degree increase in the maximum temperature.
Of course, looking at the impact of the max temp is a fairly blunt approach, so below you can see the impact on activity across various hourly temperature bins, as shown in charts 2-4.
I treated a day as rainy if precipitation was ≥ 1 mm, and only cycling had a clear, significant result: odds of a ride day were about 14% lower on rainy days (OR 0.86, p ≈ 0.02). Amazingly, running did not differ significantly on rainy days (OR 1.03, p ≈ 0.6), and walking showed only a weak, non-significant dip (OR 1.04, p ≈ 0.09). Having been a cyclist all my life, I’m glad to report that the evidence here backs up my own experience. Cycling in the rain is not much fun.
In short, heat is associated with fewer walk and run days; rain is associated with fewer bike days, with walking showing the largest temperature response in this sample.
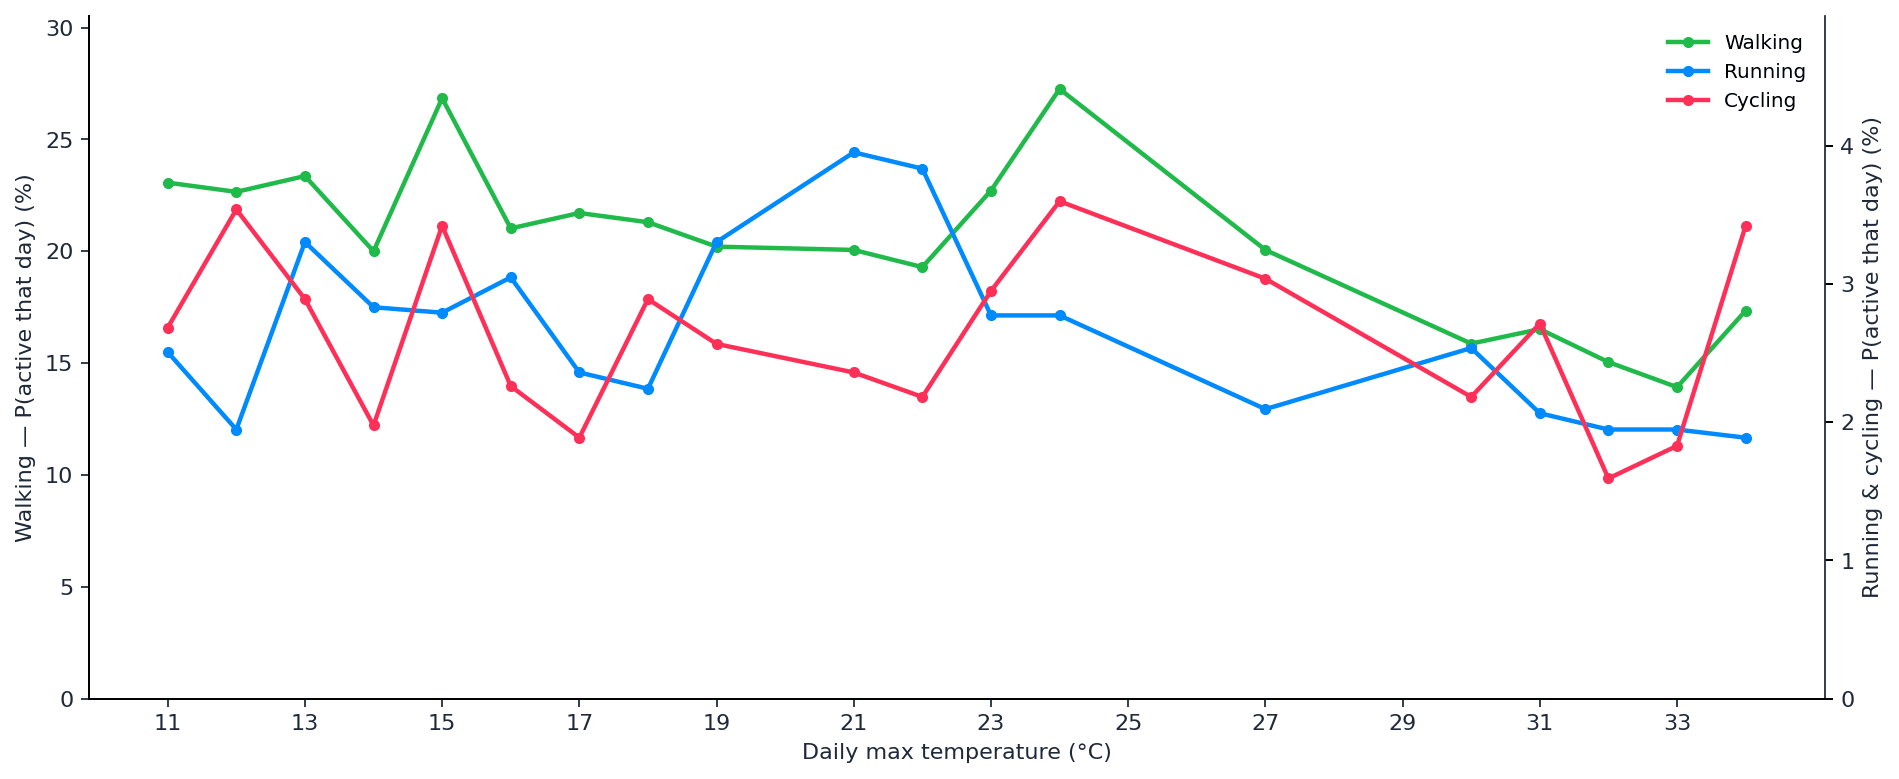
Figure 1: Does a hot day change whether people go out? Note Walking relates to the left hand axis, running and cycling to the right. The trends are messy, but all three activities see flat activity and a small peak in the low-mid twenties, and then decline.
Walking has the clearest temperature story. When the day’s maximum temperature fell within the 12–16°C range, about 24% of user–days included a walk. When the max was 32–36°C, that fell to about 15%, a large drop in how often people walked at all. In the regression (with day-of-week controls), each additional degree above the day’s maximum temperature was associated with lower odds of a walk day; the effect was strong and statistically significant.
Running showed a gentler pattern: participation peaked around 20–24°C max (~3.5% of user–days) and fell on the hottest days (~2% at 32–36°C). The temperature link was significant but small. Heat matters, but running is relatively infrequent in this data, so the day-to-day shift is modest in percentage points.
Cycling was much flatter across temperature bands in the chart, and the daily temperature regression was not significant. This is interesting because I’d expect cycling to be the most temperature-dependent, and I wonder if this is because the sample is heavily dominated by commuters who ride in most weather conditions.
Comparing activity to max and min daily temperature is a relatively “blunt” analysis. What about humidity, what about sun strength, etc. Next I decided to investigate if exercise timings moved during hotter weather.
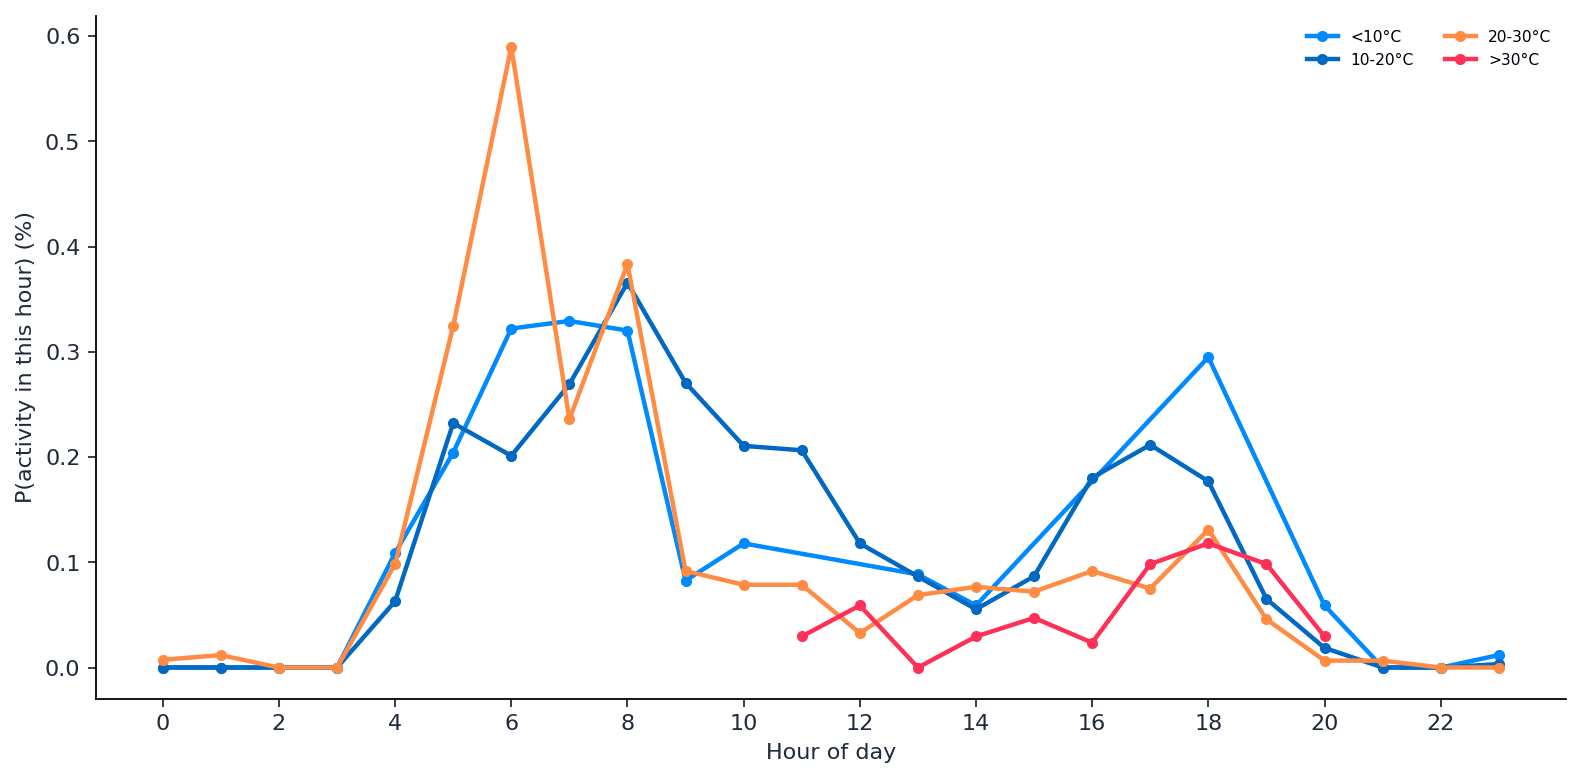
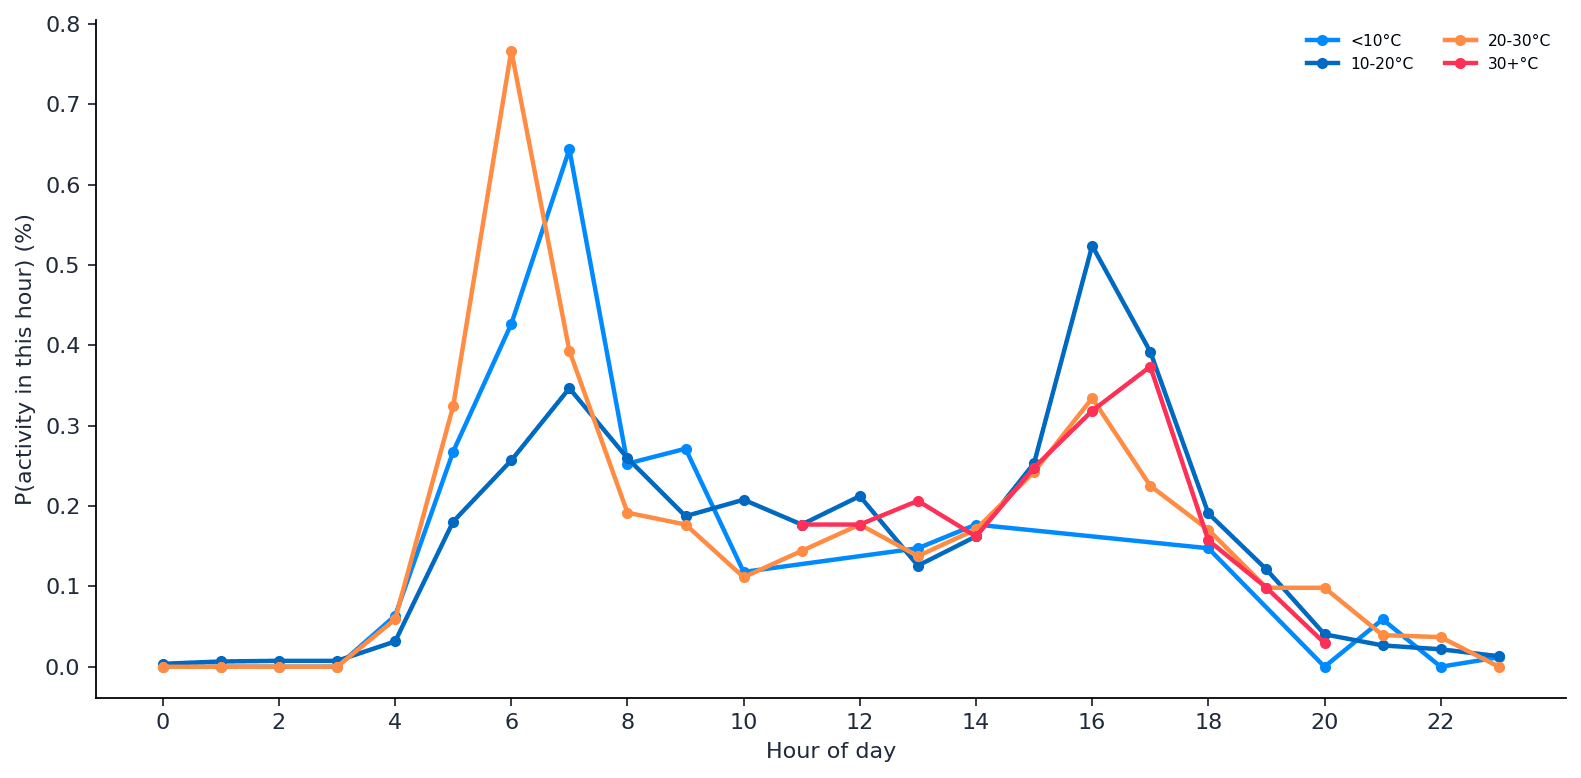
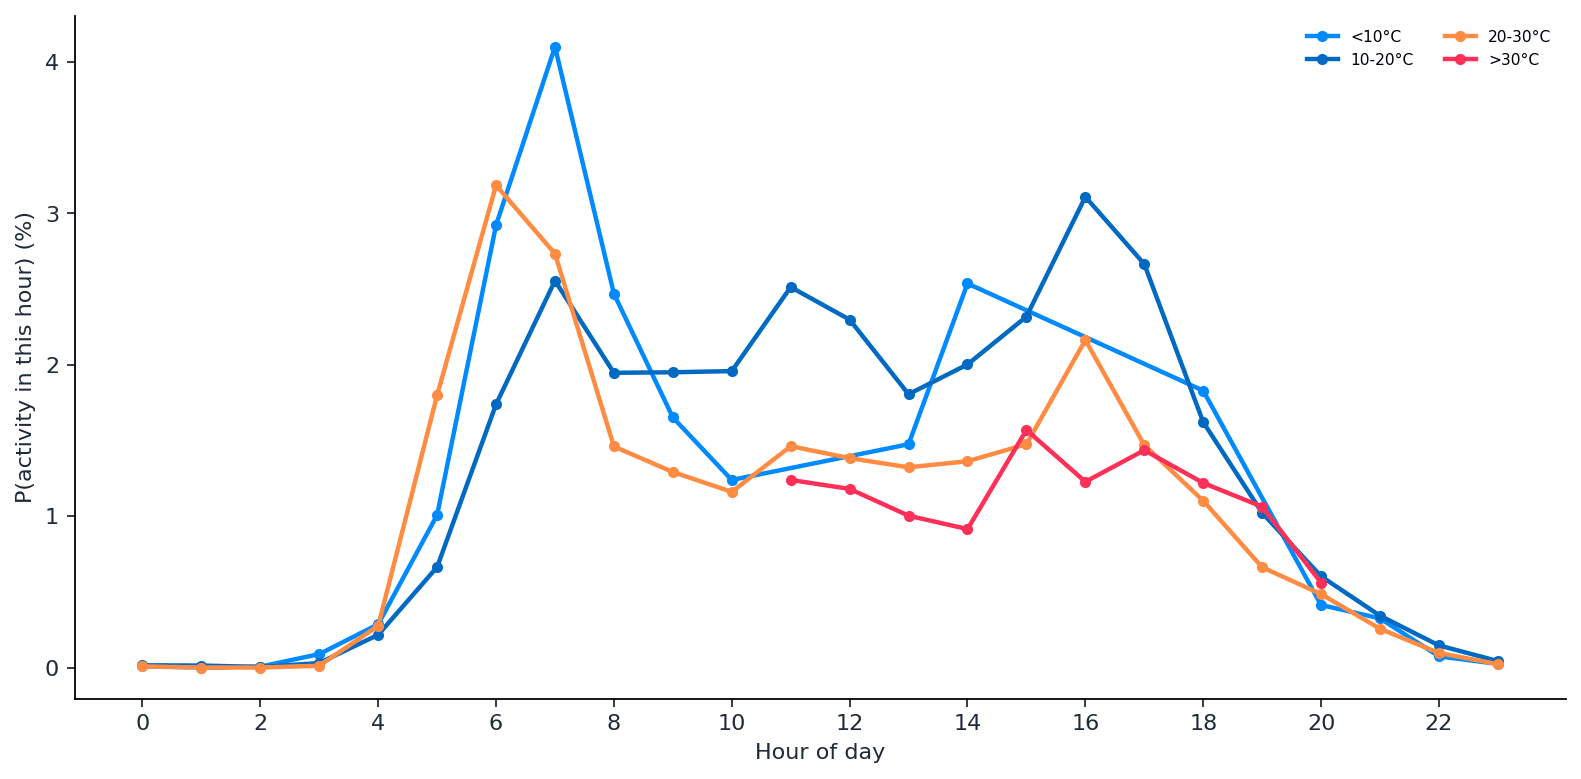
Figure 2: When do people go running, and does timing shift with temperature? Most runs still cluster in the morning and late afternoon. On days when the daily max was ≥ 24°C, the peak hour for starting a run moved earlier (around 6:00 vs 8:00 on cooler days), and activity in the 7–8 a.m. window was lower on hot days. That fits people avoiding mid-morning heat, even when they still run.Figure 3: When do people go cycling, and does timing shift with temperature? Ride starts still peak around 7 a.m. on both cool and hot days. Hourly lines cross by temperature band without a simple “only cycle when it’s cool” picture. It’s consistent with Chart 1, where daily heat did not strongly predict a ride day. Again, I wonder if we are seeing a strong “commuter” effect here. A future analysis should do a detailed day of the week analysis here.Figure 4: When do people go walking, and does timing shift with temperature? Walking holds its morning and afternoon peaks across temperatures, but hot days flatten the activity throughout the day.
Walking dominates volume and keeps a strong morning and afternoon pattern. Hourly temperature lines are closer together than the daily chart suggests; the big heat effect shows up more in whether people walk that day than in a dramatic reshaping of the activity by the hour.
This is an interesting finding, but it probably points to people using walking as a utility form of transport.
What did we learn?
Finding
Strength
Hotter days → fewer walk days
Strong
Hotter days → fewer run days
Significant but smaller effect
Hotter days → cycle days
Not significant
Rain → fewer cycle days
Significant
Rain → run / walk
Not significant (walk borderline)
Runners start earlier on hot days
Descriptive (hourly), plausible/probable!
Conclusion
For this cohort, weather is most evident in whether people go for an outdoor walk on a given day, with a meaningful drop on the hottest days. Running follows a similar direction but with weaker intensity. Cycling is less about temperature in May and more about rain reducing the chance of a ride day, unsurprisingly!
Hourly data confirm what we’d expect for runners: on hot days, they not only skip more often at certain times but, when they do go, they tend to start earlier. Although I can’t draw fixed conclusions from this analysis we can say there are strong signals to suggest that heat and rain are linked to participation in London
What’s next? Length and intensity?
This analysis only asks if a session started. It does not yet ask how much people did on days they went out; distance, duration, heart rate, pace, or effort. Next, I am going to look at how the weather affects the activities people engage in in London, and maybe even see if there is a detectable physiological impact.
References
García-Witulski C, Rabassa M, Melo O, Sarmiento JH. Effects of climate change on physical inactivity: a panel data study across 156 countries from 2000 to 2022. The Lancet Global Health. 2026;14(4):e500-e511. doi:10.1016/S2214-109X(25)00472-3 Full text
Wagner AL, Keusch F, Yan T, Clarke PJ. The impact of weather on summer and winter exercise behaviours. Journal of Sport and Health Science. 2019;8(1):39-45. doi:10.1016/j.jshs.2016.07.007 Full text / PubMed
Ho JY, Lam HYC, Huang Z, et al. Factors affecting outdoor physical activity in extreme temperatures in a sub-tropical Chinese urban population: an exploratory telephone survey. BMC Public Health. 2023;23:123. doi:10.1186/s12889-022-14788-0 Full text
Périard JD, Eijsvogels TMH, Daanen HAM. Exercise under heat stress: thermoregulation, hydration, performance implications, and mitigation strategies. Physiological Reviews. 2021;101(4):1873-1979. doi:10.1152/physrev.00038.2020 Full text / PubMed
Tucker P, Gilliland J. The effect of season and weather on physical activity: a systematic review. Public Health. 2007;121(12):909-922. doi:10.1016/j.puhe.2007.03.009 Full text / PubMed
Summary questions
Do Londoners actually exercise less when it's hot?
Yes, but it depends on the activity. Across 1,695 May-active users and 20,044 outdoor sessions, walking dropped from about 24% of user-days at 12–16°C to roughly 15% at 32–36°C, and running fell from ~3.5% at 20–24°C to ~2% at 32–36°C. Cycling, however, stayed essentially flat across temperature bands.
How much does each extra degree of heat actually reduce my chance of going out?
In the logistic regression with day-of-week controls, each additional 1°C on the daily maximum was associated with an odds ratio of 0.98 for both walking and running — roughly a 2% drop in the odds of going out per degree. Cycling had an OR of 1.00 and was not statistically significant. Walking carried the strongest and most significant temperature response in the cohort.
Does rain stop people from exercising in London?
Only if they're on a bike. Days with ≥1 mm of precipitation saw cycling odds drop about 14% (OR 0.86, p ≈ 0.02), while running was unaffected (OR 1.03, p ≈ 0.6) and walking showed only a borderline dip (OR 1.04, p ≈ 0.09). Rain is a cyclist's problem far more than a runner's or walker's.
Do runners change when they head out on hot days?
Yes — they shift earlier. On days where the daily max hit 24°C or above, the peak start hour for runs moved from around 8:00 to around 6:00, and the 7–8 a.m. window saw noticeably fewer starts. Runners aren't just skipping hot days, they're rescheduling to dodge mid-morning heat.
Why doesn't cycling drop off in the heat like walking does?
The most likely explanation is that the cycling sample is heavily commuter-driven. Cycle starts peaked around 7 a.m. on both cool and hot days, and the daily temperature regression was non-significant — consistent with people riding to work regardless of conditions. Rain, which makes commuting genuinely unpleasant, was the only weather variable that meaningfully shifted ride days.
Why measure whether people went out at all instead of total minutes or distance?
Because outdoor running and cycling are rare events — only about 2.5% and 2.4% of user-days respectively, versus 19% for walking — daily volume totals get noisy fast. The analysis also held the user base fixed at the same 1,695 people across every May day, so a hot Tuesday is compared against a mild Tuesday for the same cohort. Participation (P(active that day)) is the cleanest signal when sample composition would otherwise distort the result.
Which activity is most weather-sensitive overall?
Walking, by a wide margin. The gap between cool-day and hot-day walk participation was roughly 9 percentage points (24% → 15%), whereas running's hot-day shift was only about 1.5 points and cycling barely moved with temperature at all. Walking likely doubles as utility transport, so when heat makes it unpleasant, people simply skip the trip.
Can wearable data really detect weather effects on exercise behaviour?
Yes. Pairing 20,044 outdoor sessions with Open-Meteo hourly weather data was enough to surface statistically significant heat effects on walking and running, a clear rain effect on cycling, and an earlier shift in run start times on days above 24°C. The approach captures population-level behavioural responses to weather without surveys or self-report — though it currently measures participation only, not duration, intensity or physiological strain.