We use cookies to enhance your browsing experience and analyse our traffic. Nothing beyond essential cookies runs until you choose. You can change your mind any time in our Cookie Policy.
The Terra Fitness Score shows whether you are faster at the same heart-rate effort, and this blog explains how it compares with VO₂max, critical power and FTP.
What it measures. It shows whether you've got fitter in the way most of us actually mean it: faster for the same physiological effort. It measures this as speed, or power on the bike, at a given heart-rate effort.
How it compares. It sets your latest three weeks against the month before, and against an older three-week block that you can place as far back as your data goes, from three months to a year or more. It's split into easy, tempo and hard running, so you can see whether you're improving, holding steady or slowly giving speed away.
Where it fits. It doesn't replace VO₂max or critical power, which tell you your ceiling and the hardest effort you can hold. It answers a more everyday question in a unit you can feel on your next run.
A score is only worth the behaviour it changes
I think this Fitness Score can help a person more than their VO₂max.
Scores, in my opinion, are about mathematical (and scientific) validity, and how well they communicate to the user. And this second part is a fascinating element of behavioural psychology. On one hand, you have Goodhart's law, often summarised as: when a measure becomes a target, it’s no longer a good measure. On the other hand, you have my belief that a score is only as valuable as the behaviour change it drives.
So it seems to me that a score that tracks fitness by saying you are running quicker at the same heart rate is more valuable than one measured in ml/kg/min. In training, I think you want to know what effect your training is having; in a unit you can feel. Speed. On a bike, the same idea is power.
VO₂max is a real physiological ceiling, and the longevity literature around it is impressive. I have written about why that ceiling predicts how long people live.
But fitness isn’t all about capacity. Most of us who train use fitness as a catch-all term, and it means different things to different people. But we can probably all agree on one definition: you get fitter by becoming faster for the same physiological cost. This score measures that.
Get the latest Terra Research reports and insights every week as soon as they're published.
The core of this score is speed (or power) at a given physiological effort (or intensity, strictly), measured as heart-rate reserve. Heart-rate reserve is the difference between your max and resting heart rate, a way to standardise heart rate. It uses your own resting heart rate and your own max, so the comparison is about pace at a given effort, for you. Resting heart rate isn’t fixed either. It usually drops as you get fitter, so each block uses its own resting heart rate, taken from the 30 days of data before it. Fifty per cent is a comfortable aerobic run. Eighty per cent is tempo. Ninety per cent is hard.
The score presents fitness as a change in speed (power for cycling). A score of 0.4 km/h, held across a real range of effort, means a person has become fitter. There are two comparisons: recent and long term. The recent comparison asks whether we can see a change in fitness in the last month. The longer one asks whether the last year saw improvement. Many people are not training to become much faster. They need to know they are not falling away. A steady loss is the one to take seriously. Or maybe that is just me!
The mortality evidence that makes VO₂max interesting is, at its best, evidence about change. Men who went from unfit to fit died less often than men who stayed unfit. Holding or gaining fitness tracked with a lower risk even after change in body mass index was accounted for. The direction of travel is the part a person can act on.
What it does
This version is a running score. The cycling version is the same comparison with power in place of speed. Each score compares two blocks of about three weeks. The analysis blocks stay that length. A longer history moves the older block further back.
The recent score is the latest three weeks against the three weeks before that, with a one-week gap between them. That is “have I got fitter in the last month?”
The longer score keeps that same latest three weeks and places the older block further back, as far as you choose. Three months is the shortest placement. Twelve months seems a sensible window to compare: the runner you are now, against a three-week snapshot of the runner you were a year ago, but it can go back as far as your data allows.
A second of data is used only if you’re actually running, it’s outside the first and last three minutes, and speed and heart rate are both steady. Hill sessions that climb more than about 50 metres per kilometre are dropped. These are many of the same limits I keep coming back to with wearable estimates.
A heart rate is used only when both blocks have at least 30 steady seconds within about 2 points of reserve. A zone is left blank unless that shared effort covers about 5 points of reserve inside it. Easy is roughly 50–72% of reserve, tempo 72–87%, hard 87–97%. If the two blocks do not both include hard running, no hard analysis is done.
What you see is three zone shifts, in km/h, then the average across the heart rates both blocks covered. When easy and hard both exist and differ by at least 0.1 km/h, one line says whether the gain grows toward harder efforts or is larger at easier efforts. The same average can be an aerobic base that has come on, or a top end that has come on. Knowing which one may help you decide what to train next.
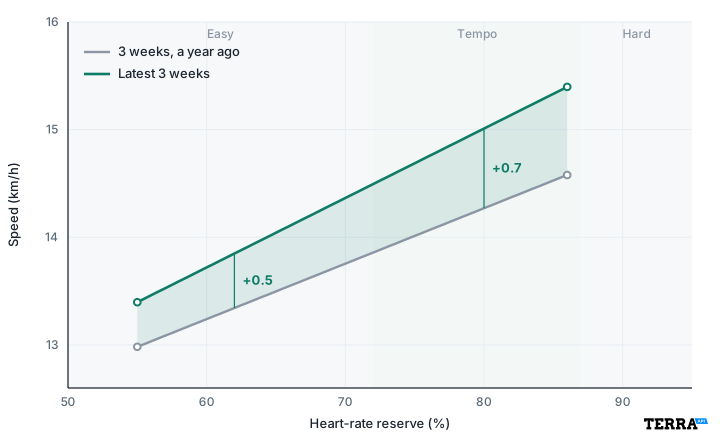
Here is an example, not a real runner. Two three-week blocks, a year apart. The lines stop where the shared steady running stops, so the hard zone is empty. The gain is about 0.5 km/h in the easy running and about 0.7 km/h at tempo.
Figure 1. The fitness score. An example, not a real runner. Grey is three weeks from a year ago. Green is the latest three weeks. The numbers are how much faster the new block is, in km/h, at that heart-rate reserve. The lines stop before Hard in this example because the two blocks didn’t have that effort.
Besides the shifts, we display a confidence score based on how many runs sit in each block, how wide the shared effort is, and whether a lot of hilly runs were thrown out. High confidence means the shift is worth believing. Low confidence means you should collect more steady running before you change your training.
How is it different to other numbers?
If you’ve read my previous blogs on analysing exercise with wearable data, you’ve probably realised that this score is just part of the VO₂max algorithm. This is true, and it has two big advantages. Firstly, as I mentioned above, I think it’s more relatable and actionable. Secondly, it’s closer to the “ground truth”. To get a wearable-derived VO₂max from this analysis, you are not introducing any new data, just more assumptions.
How does this score differ from other numbers that put fitness into one figure, such as critical power, critical speed, and functional threshold power (FTP)?
Critical power, as an idea, was described by Monod and Scherrer in 1965. Take the best power you can hold for several durations, and the curve falls toward an asymptote. That asymptote is critical power. In the model, the line goes on forever. I’ve always found the real definitions a bit fluffy because we are trying to map a mathematical concept on to messy physiology, but I think of it as the highest power at which the effort is sustainable for tens of minutes. The power you can hold for about an hour is closer to FTP, which usually sits a little below critical power. Above critical power you are spending a finite “store” of work, usually called W′ (W prime), and the time you have left is roughly that store divided by how far above critical power you are. Most of us who do hard exercise would describe this as “being in the red”. In running the same model is critical speed (Hughson and colleagues applied it to treadmill running in 1984), and the store is a distance, D′.
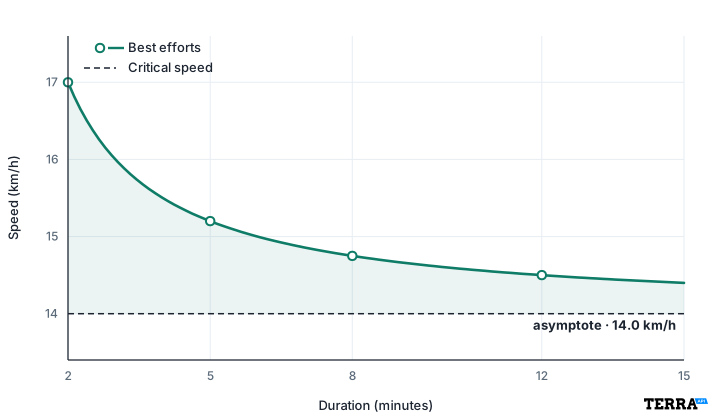
Here is the running picture, drawn from two to fifteen minutes. That is the window these curves are usually fitted in. The dots are best efforts. The curve falls toward a horizontal line and does not cross it. That line is the critical speed: 14.0 km/h in this example. At fifteen minutes the curve is still above the line. Drawing the same formula out to forty minutes, or to an hour, still leaves the line just under the curve. A real effort that long usually drops through it, and the lower number is what FTP is aiming at.
Figure 2. Critical speed. Best efforts, and the curve through them, from 2 to 15 minutes. The dashed line is the asymptote, 14.0 km/h. Inside this window the curve stays above it.
Physiologically, it sits near the boundary between heavy and severe exercise. Below it, oxygen uptake and muscle chemistry can stabilise. Above it, oxygen uptake climbs toward its maximum and you have a limited ability to carry on exercising. That is why a good critical power predicts performance from a few minutes out to about half an hour, and why training zones are often hung off it, or off FTP.
FTP is a single point taken from the same relationship. It is usually the power you can hold for about an hour, or 95% of a twenty-minute test, and training load is often scaled to it. The practical versions (a power-duration model in TrainingPeaks or WKO, GoldenCheetah, Intervals, a Stryd critical power) are built from your best efforts at several durations, or from a formal test. There is some debate about how many points you need to predict the curve. Three efforts, spread across roughly two to fifteen minutes, are the usual minimum. More points help when they sit in that window.
One runner, measured both ways
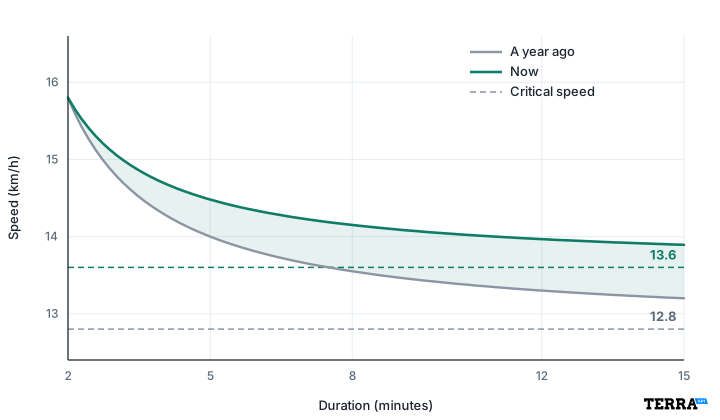
These two charts are one imagined runner, a year apart. The first is a speed–duration curve: best speed against how long it was held. The dashed lines are the critical speeds the curves fall toward. The short efforts barely move. A year later the curve settles higher, from 12.8 km/h to 13.6.
Figure 3. Critical speed, a year apart. Two curves for the same runner, from 2 to 15 minutes. Short efforts barely change. The dashed lines are the critical speeds, 12.8 km/h then 13.6.
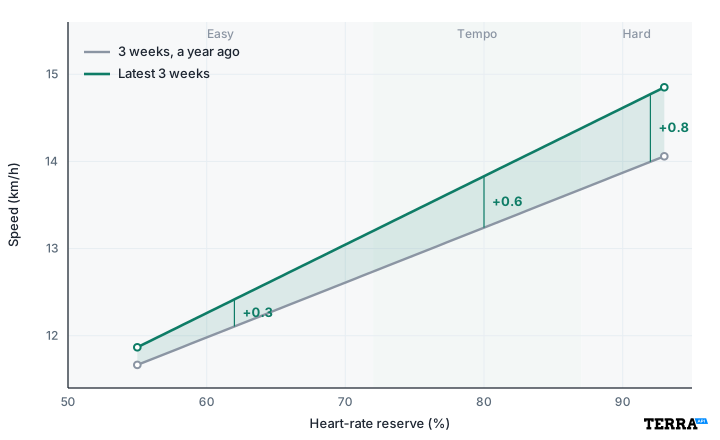
The second picture is that same year as the fitness score. These blocks shared the hard running, so the lines go through it. Easy is about +0.3 km/h, tempo about +0.6, and hard about +0.8. That hard gain is the same size as the rise in critical speed.
Figure 4. The same year, as the fitness score. Ordinary three-week running, this time through the hard zone. The gain grows toward harder efforts: about +0.3 km/h easy, +0.6 at tempo, and +0.8 in the hard running.
This score answers the question: at the efforts you actually repeated, did the same physiological cost buy more speed?
There are various advantages and disadvantages to presenting physical performance in both forms. Critical power needs those hard efforts to get an accurate curve. Outdoor speed is also a messy input for critical speed: hills, wind, and surface all have impacts and require correction. Critical speed is probably not very sensitive when the thing that changed is your easy running: faster at 60% of reserve, same heart cost, and no new best efforts at five minutes and twenty minutes.
On the flip side, a fitness score that uses heart rate has a bunch of disadvantages. Heat, caffeine, altitude, a poor night, and cardiac drift all push heart rate up at the same speed, so this score can move for reasons that are not fitness. Critical power taken from a power meter follows the work you did. It is an objective performance output measure. When you have fresh maximal efforts and a trustworthy power meter, critical power is the cleaner performance number. When you have a year of normal runs, and you want to know whether they made you faster at the effort you actually do, a heart-rate comparison is more relevant.
Pegging performance to heart-rate reserve isn't perfect, and I don't want to oversell it. The reserve is only as good as its two endpoints, and both have drawbacks: resting heart rate shifts with sleep, illness, and stress, and maximum is often an age-based guess rather than a true peak. Even if it is an exercise-based peak, it's hard to know whether it is a true maximum. A wrist sensor also adds noise, heart rate lags behind effort, and the same speed can cost more beats on a hot day or when the heart is stressed from non-exercise. So I wouldn't read one heart-rate reserve percentage as a precise physiological fact. But I'd still defend it as the least worst option. It needs no maximal test, it works on the ordinary runs people actually do, and it is comparable with your own earlier running. The errors also tend to be similar from block to block in the same person, so a change is more trustworthy than a single absolute number. The steady-effort filters and the confidence score catch cases where it shouldn't be trusted.
Model
The question it answers
What it needs
This score
Did speed, or power, at the same effort change?
Steady sessions with heart rate, in both blocks
Critical power
Highest power or speed at which oxygen uptake can still stabilise, and how long you can go above it
Best efforts across several durations
FTP
What is your threshold?
A hard test, or a point taken from the power-duration curve
Training load (CTL)
How much stress have you absorbed?
A record of session load, scaled to a threshold. On the bike that threshold is FTP
Efficiency factor
How much pace or power per heartbeat in that session?
One session with heart rate
VO₂max
What is the ceiling?
Ideally a CPET (cardiopulmonary exercise test), or an estimate from effort
What numbers actually matter?
I would still want a VO₂max when the question is the ceiling. I would want a critical power when the question is the hardest steady output you can hold, and you have the efforts to define it, especially for efforts lasting a few minutes up to about half an hour. If you are not looking for exercise performance and you want a slightly more holistic view of your fitness, I would use the fitness score to answer the simple question: “At this effort, am I faster than I was, and am I holding that speed or giving it up?”
I started by saying a score is only worth the behaviour it changes. Seeing that the same effort now buys you more speed, in a unit you can feel on your next run, is the clearest nudge I know of to keep doing what is working.
References
Banister EW, Calvert TW, Savage MV, Bach TM. A systems model of training for athletic performance. Aust J Sports Med. 1975;7:57–61.
Hughson RL, Orok CJ, Staudt LE. A high velocity treadmill running test to assess endurance running potential. Int J Sports Med. 1984;5:23–25. DOI: https://doi.org/10.1055/s-2008-1025875
Lee DC et al. Long-term effects of changes in cardiorespiratory fitness and body mass index on all-cause and cardiovascular disease mortality in men. Circulation. 2011;124:2483–2490. DOI: https://doi.org/10.1161/CIRCULATIONAHA.111.038422
Muniz-Pumares D, Karsten B, Triska C, Glaister M. Methodological approaches and related challenges associated with the determination of critical power and curvature constant. J Strength Cond Res. 2019;33:584–596. DOI: https://doi.org/10.1519/JSC.0000000000002977
Poole DC, Burnley M, Vanhatalo A, Rossiter HB, Jones AM. Critical power: an important fatigue threshold in exercise physiology. Med Sci Sports Exerc. 2016;48:2320–2334. DOI: https://doi.org/10.1249/MSS.0000000000000939
Summary questions
Why should I care about a fitness score instead of just VO₂max?
VO₂max tells you about a physiological ceiling in ml/kg/min — a unit you can't feel on a run. The Terra Fitness Score instead tells you whether you're running faster at the same heart-rate effort, in km/h (or watts for cycling). Since fitness, by most people's definition, means getting more speed for the same physiological cost, this score measures that directly — and the mortality evidence that makes VO₂max compelling is really evidence about change, which is exactly what this score tracks.
How does the score actually decide I've gotten fitter?
It compares two blocks of about three weeks of running and measures the change in speed at matched heart-rate reserve zones: easy (50–72%), tempo (72–87%), and hard (87–97%). The recent score pits the latest three weeks against the three weeks before, with a one-week gap. The longer score compares your latest three weeks against a block from 3 to 12+ months ago. A gain of around 0.4 km/h held across a real range of effort means you've genuinely become fitter.
What data actually gets used — does every run count?
No. A second of data is only used if you're actually running, outside the first and last three minutes, with steady speed and heart rate. Hill sessions climbing more than ~50 m/km get dropped. A heart rate is only used when both blocks have at least 30 steady seconds within ~2 points of reserve, and a zone is left blank unless shared effort covers ~5 points of reserve. These filters exist because messy data makes heart-rate comparisons untrustworthy.
Can wearable heart-rate data really be trusted for this?
It's imperfect but defensible. Heat, caffeine, altitude, poor sleep, and cardiac drift all push heart rate up at the same speed, and wrist sensors add noise. Resting heart rate shifts with sleep and stress, and max HR is often an age-based guess. But the errors tend to be similar from block to block in the same person, so a within-person change is much more trustworthy than any single absolute number — and the confidence score flags cases where it shouldn't be trusted.
How is this different from critical power or FTP?
Critical power (described by Monod and Scherrer in 1965, and applied to running as critical speed by Hughson in 1984) requires fresh maximal efforts across durations of roughly 2 to 15 minutes to fit the curve. FTP is a single point — about the power you can hold for an hour, or 95% of a 20-minute test. The Fitness Score needs none of that: it works on the ordinary steady runs you already do, and it catches improvements in easy running that critical speed would miss entirely.
Does getting faster at easy pace matter, or only at hard efforts?
Both matter, and the score separates them. In the worked example, one runner improved +0.3 km/h at easy, +0.6 at tempo, and +0.8 in the hard zone — the same ~0.8 km/h gain seen in their critical speed over the year. The score tells you whether the gain grows toward harder efforts or sits more in your aerobic base, which helps you decide what to train next. A critical-speed curve would have missed the easy-pace progress entirely.
I'm not training to get much faster — is this score still useful?
Yes, arguably more so. Many people train to not fall away, and a steady loss is the result worth taking seriously. The mortality data backs this up: Blair's 1995 JAMA study and Lee's 2011 Circulation paper showed that men who went from unfit to fit, or who held onto fitness, died less often than those who stayed unfit — even after accounting for BMI change. Direction of travel is the actionable part, and this score makes it visible.
Why trust a change of 0.4 km/h — isn't that within noise?
That's exactly what the confidence score is for. It's based on how many runs sit in each block, how wide the shared effort range is, and how many hilly runs got excluded. High confidence means the shift is worth believing; low confidence means collect more steady running before changing your training. Combined with the steady-effort filters and the requirement for ~5 points of shared reserve in a zone, the score is designed so a reported shift reflects fitness, not noise.