We use cookies to enhance your browsing experience and analyse our traffic. By clicking “Accept All”, you consent to our use of cookies according to our Cookie Policy. You can change your mind any time by visiting out cookie policy.
Baseline metabolic rate estimates vary by up to 25% across devices for the same user.
The Keytel formula for activity calorie expenditure is the most common across devices, and devices agree within a ~60 kcal range.
Non-exercise activity calorie (passive activity) can be accounted for in baseline or daily activity calories so these metrics are not comparable across devices.
Often people own more than one wearable device because we trust some devices more for sleep and recovery and others for sports. However, this often leads to more confusion than it does to answering any of our health-related questions. During the same workout, two wearables can give two different estimates for calories.
In this blog we look into recovering calorie estimation methods across six devices and help uncover the reason why you are burning different amounts of calories on different devices.
Two types of energy expenditure algorithms
The Keytel equation[1] uses physiology to calculate the energy expenditure during activity. It uses heart rate above resting heart rate integrated across time as a proxy for oxygen consumption. This computation has a BMI component and differs between men and women:
Men: EE (kJ/min) = −55.0969 + 0.6309 × HR + 0.1988 × Weight + 0.2017 × Age Women: EE (kJ/min) = −20.4022 + 0.4472 × HR − 0.1263 × Weight + 0.074 × Age
Another way to estimate calorie expenditure is to model it as a function of motion. Motion features are coarse metrics derived from continuous accelerometer data like activity time, duration, speed, etc.
Get the latest Terra Research reports and insights every week as soon as they're published.
We can model the total daily energy expenditure as the sum of activity thermogenesis (AT), non-activity thermogenesis (NEAT) and baseline metabolic rate (BMR):
EE = AT + NEAT + BMR (Energy expenditure = activity thermogenesis + non-exercise activity thermogenesis + baseline metabolic rate)
Activity thermogenesis is the calories we burn while exercising, and is a function of effort. Non exercise activity thermogenesis refers to the calories we burn while moving but not exercising. This could include moving around the office, cooking or fidgeting.
Activity Thermogenesis
When modeling the activity thermogenesis during recorded activity sessions, devices generally use a variant of one of the two expenditure algorithm families, the HR reserve-based (Keytel) or the motion-based, or alternatively a combination of both.
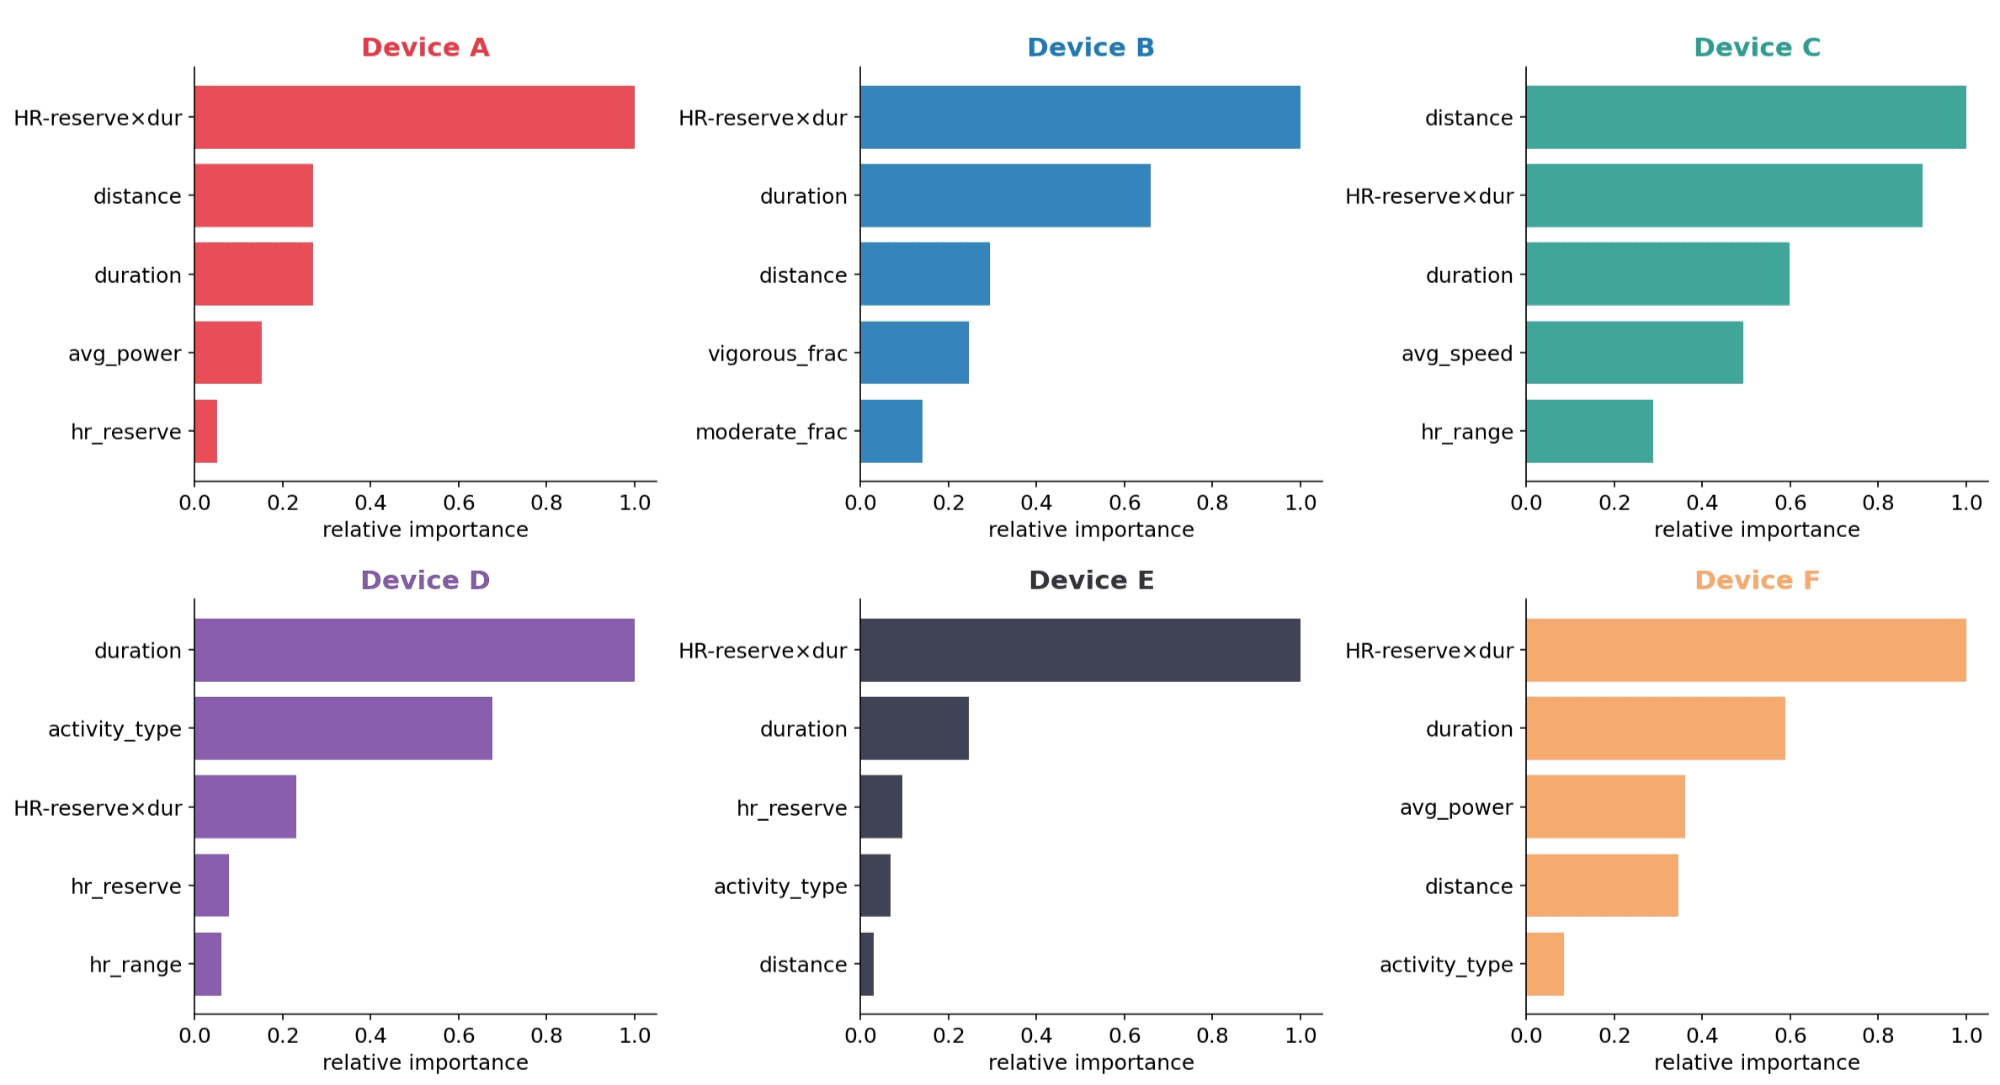
We use a LightGBM model with HR reserve integral and motion features as inputs to decompose each device’s formula. How well these formulas are ‘decoded’ was measured by computing the R^2 value on a test-set. We then plotted the SHAP importances for each input feature.
Devices A, B, E and F are predominantly driven by the HR reserve formula, device C ranks HR reserve as the second most important feature while device D relies more on motion-derived features.
Device
R^2
N sessions
A
0.900
191,667
B
0.904
24,928
C
0.740
140,856
D
0.808
340,002
E
0.955
88,786
F
0.856
60,073
Figure 1: SHAP importances for the input features of the activity session calories LightGBM models.
Non-exercise Activity Thermogenesis
Most devices report per-activity session calories (activity thermogenesis), which we just decomposed, and total daily activity calories. In an ideal data scenario the total activity calories in a day would be defined as:
Total Activity Calories = Σₐ ATₐ + NEAT (All activity-session calories summed, plus the non-exercise component)
or in other words, all activity session calories summed plus the non-exercise component.
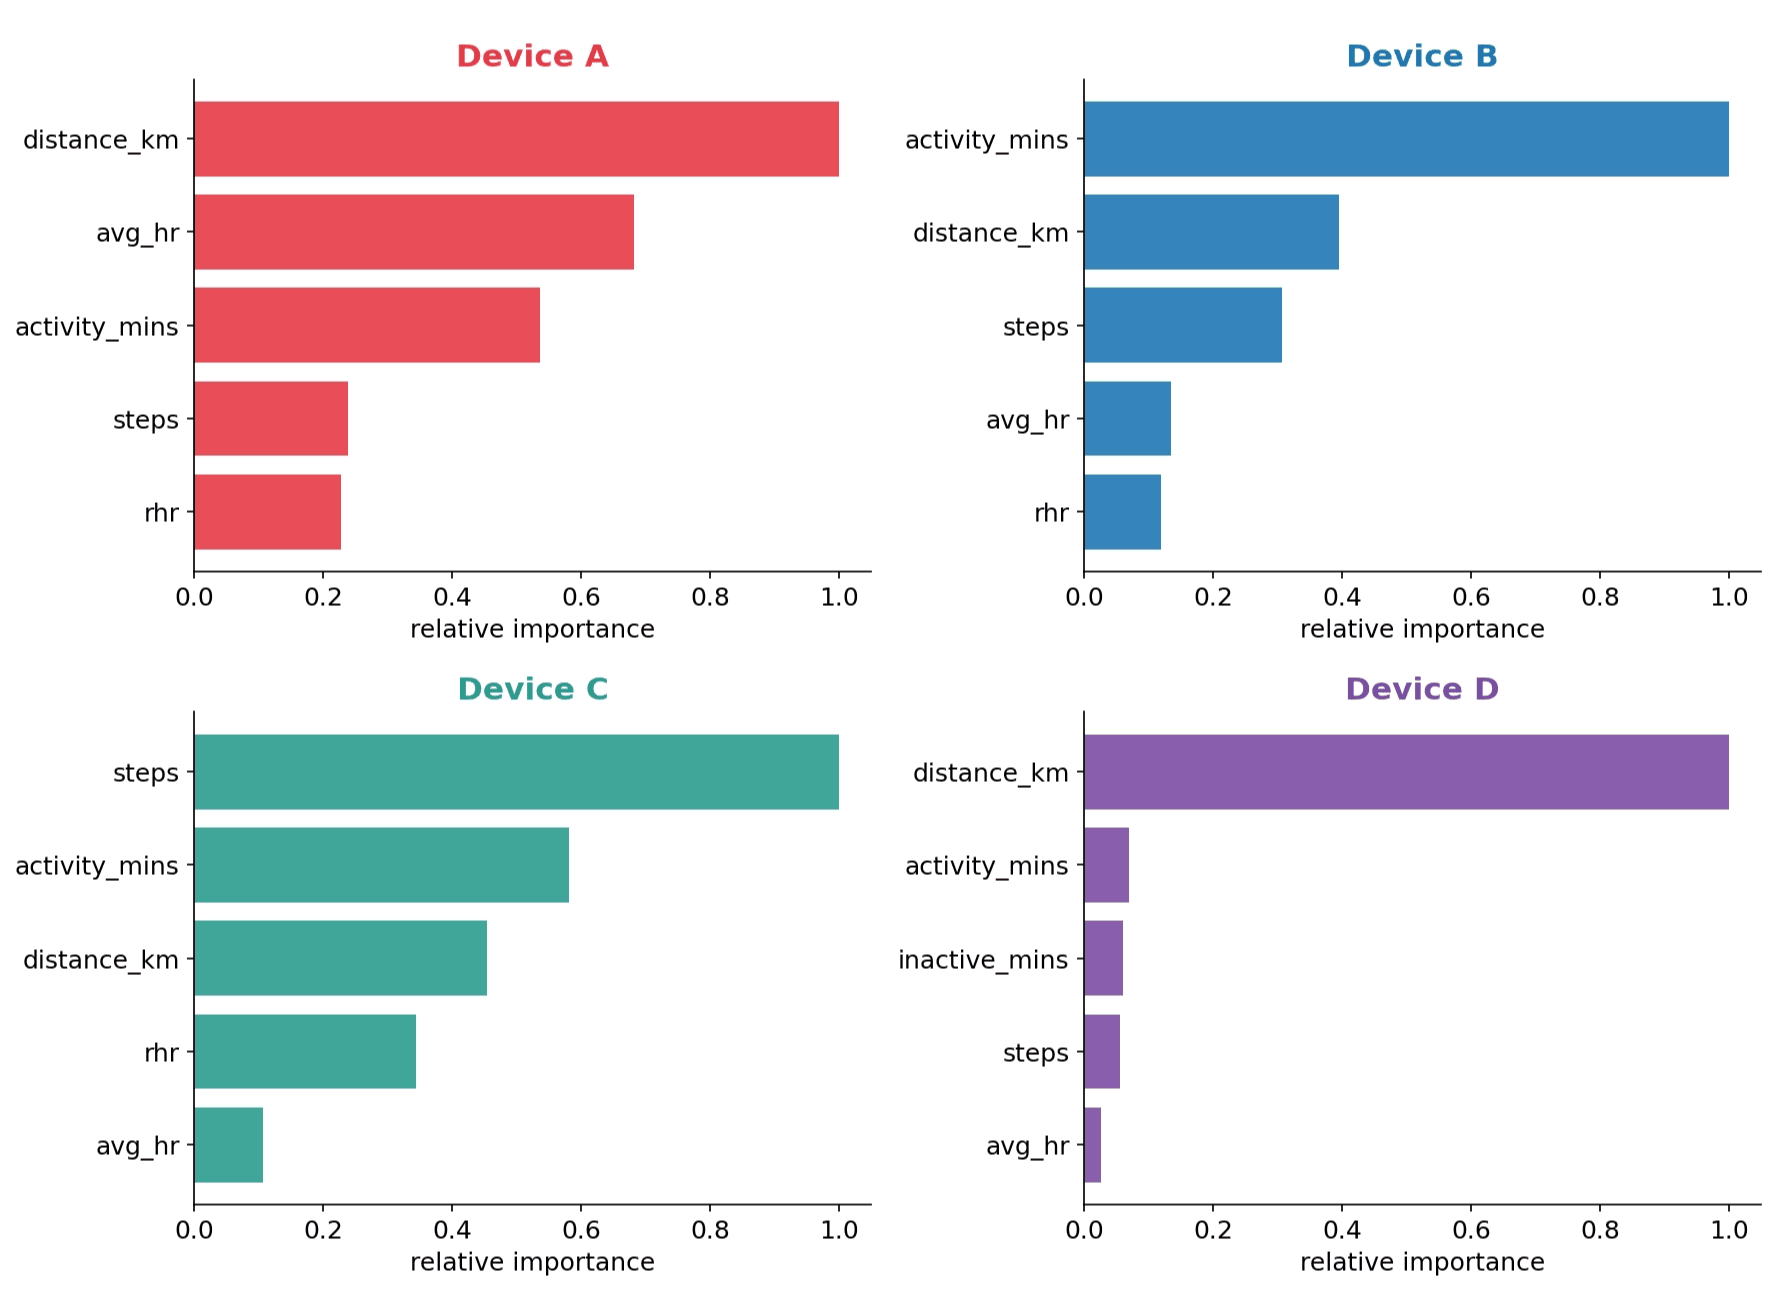
To decode how different devices compute these non-exercise calories we look for days with no activity sessions logged (Total AT = 0) and model total daily activity calories. Similarly to AT calories, we use a LightGBM model and a range of features including steps, distance and average heart rate.
Device
R^2
N days
E
-
-
B
0.825
26,586
A
0.744
322,029
F
-
-
D
0.937
589,166
C
0.384
562,275
NEAT calories are decomposed with a lower R squared value than activity session calories, which we suspect is a data granularity problem. NEAT calories happen from daily movement that can be captured with accelerometer data but is less reflected on our heart rate or distance.
This is because small activities like fidgeting or moving while sat down contribute to NEAT but not to total steps.
Figure 2: SHAP importances for NEAT calories LightGBM models.
Most devices agree on the most important features for NEAT, these are distance and steps. Devices E and F were excluded as they do not report the total daily activity calories and/or baseline metabolic rate to isolate NEAT calories.
Baseline metabolic rate
We assume baseline metabolic rate to be constant within a user, and likely derived from BMI, as devices show within user CVs between 0.1 and 12%. There have been multiple formulas developed and refined throughout time with the gold-standard being the Mifflin St-Jeor formula.
BMR (Mifflin-St Jeor) = 10W + 6.25H − 5A + S (S = 5 for men, S = −161 for women)
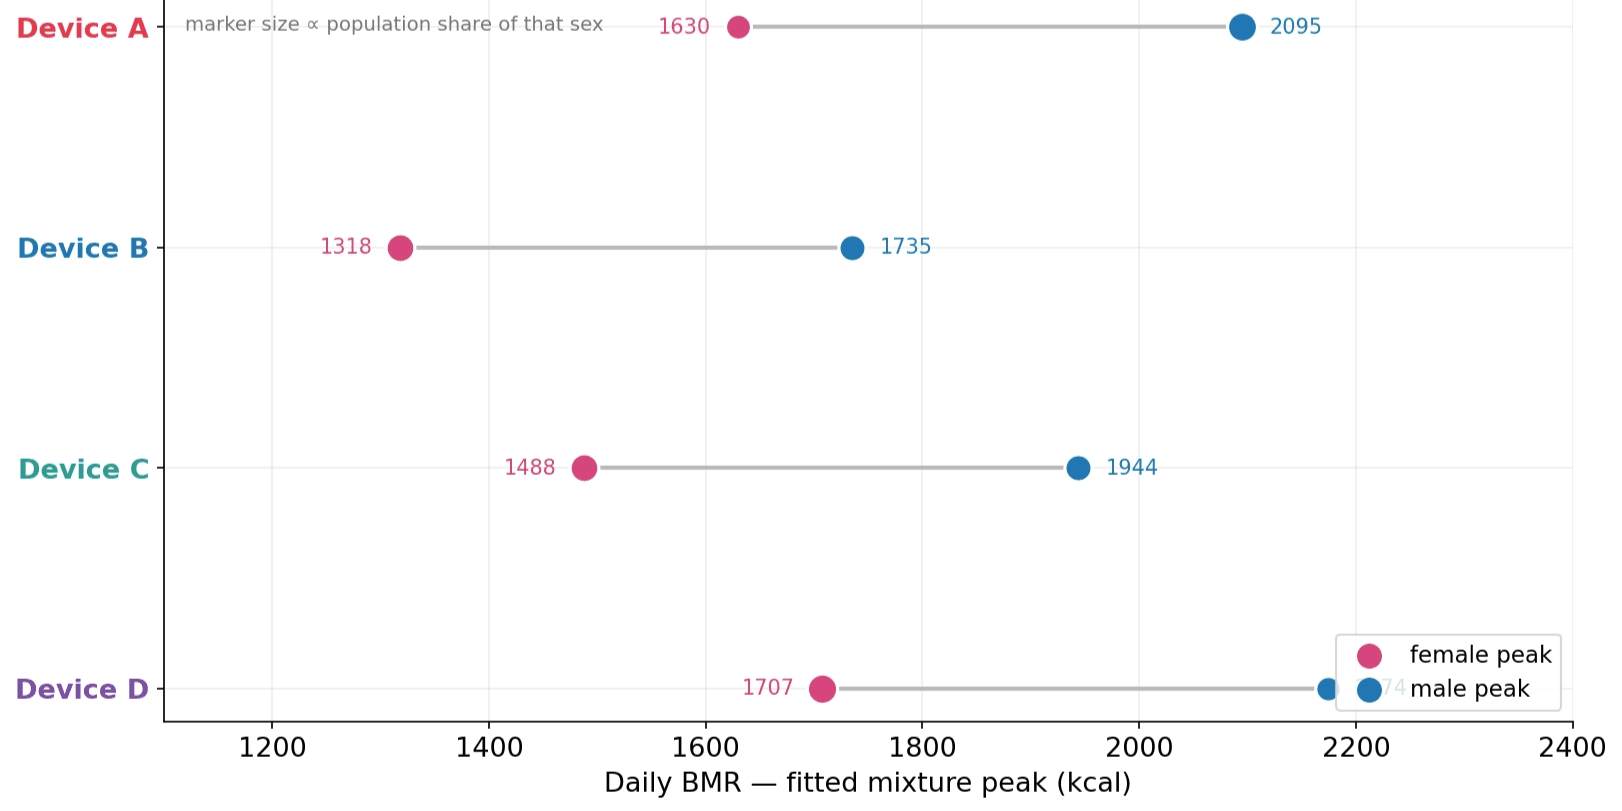
We modeled baseline metabolic rate distributions as a 2-component gaussian mixture to account for sex differences and found the biggest disparities across devices in this analysis. Device B consistently scores lower and device D gives the highest estimates.
Figure 3: Median baseline metabolic rate by sex and device.
There are multiple factors that can cause these distribution differences:
Population bias: different devices attract different profiles
BMR vs RMR: baseline metabolic rate is the minimum expenditure to sustain the body while the resting metabolic rate absorbs some of the NEAT calories and is higher.
Noise and different formula coefficients across devices.
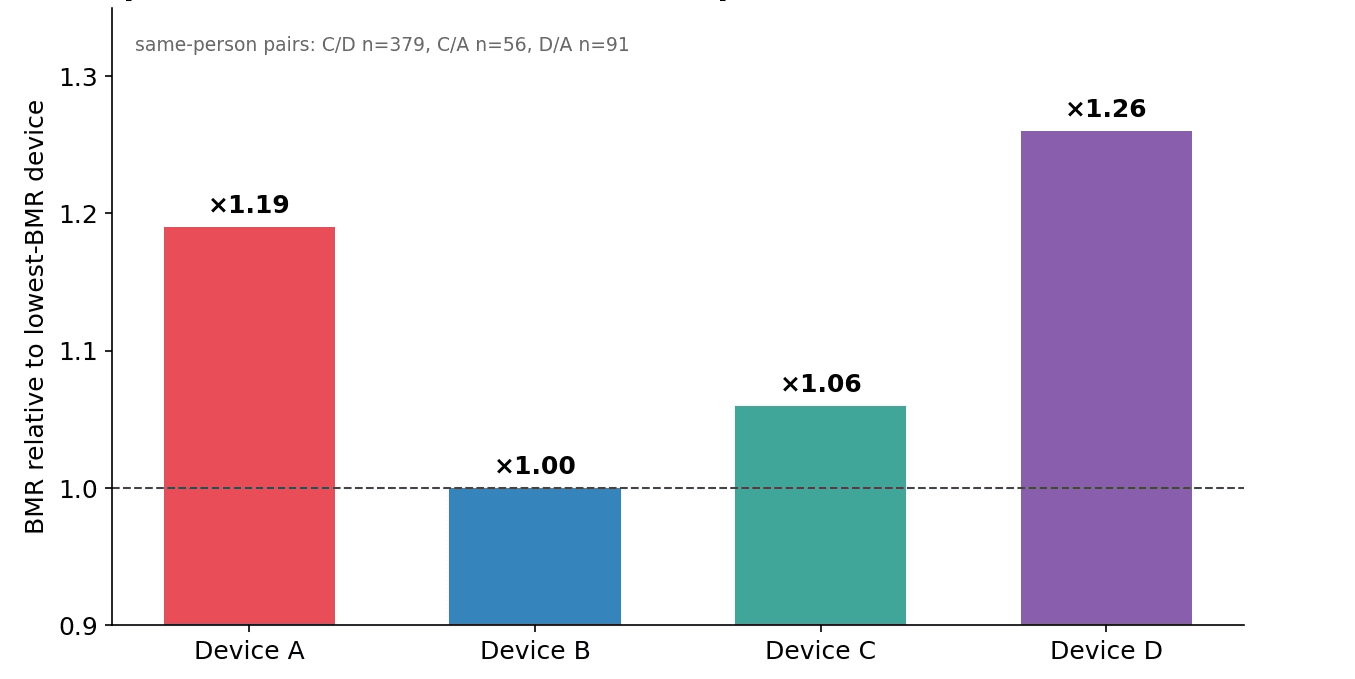
For users with two devices we ran direct comparisons for the baseline metabolic rate estimation and found the same disparities which discards the population bias.
Figure 4: Same-user baseline metabolic rate comparison across different devices.
We assume device B reports BMR, as it is the lowest. Its NEAT calories are also the only mainly explained by activity minutes which align with the hypothesis that its BMR does not absorb any of the NEAT calories. Devices A and C are likely reporting RMR instead of BMR which is why they score higher, and device D’s high BMR estimates remain unknown.
How much do devices agree?
Apart from baseline metabolic rate which we have found to be very different across devices, most devices agree on the contributors for active calories. These are generally HR reserve and duration for activity session calories, and steps or distance for passive non-exercise calories. However, despite the ranking of features being the same across devices the total numbers can still diverge.
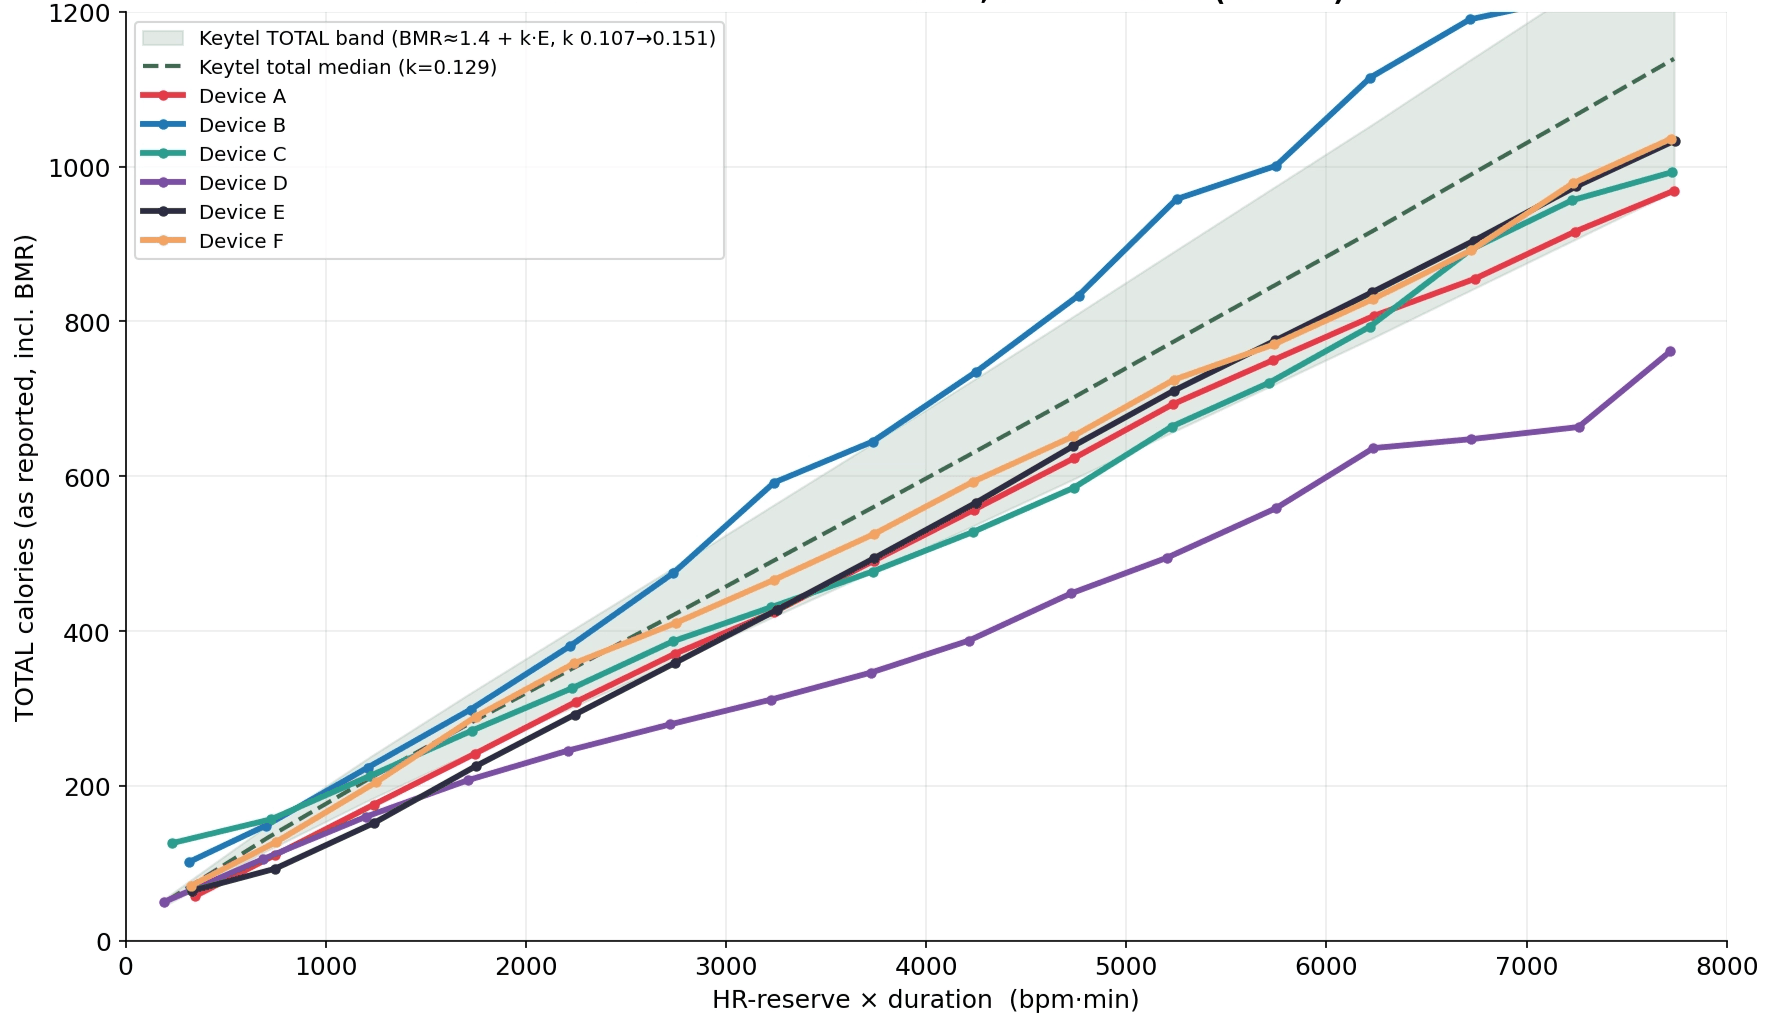
Taking HR-reserve integral as the gold-standard approach for calorie estimation, we plot the mean calories reported for each device at different efforts. We can see a general agreement at low intensities, but differences grow as the integral of HR reserve increases.
Device B predicts higher calorie expenditure than the gold-standard Keytel rule while device D (motion-feature based) consistently predicts lower.
Figure 5: Activity session calories against cardiovascular effort, defined as the integral of HR-reserve over time.
What does this mean?
If you are one of those users owning multiple brands of wearables and can’t decide which one to follow, probably neither, or all of them! The largest differences in calories come from baseline metabolic rate estimates.
Some devices include passive activity calories within your baseline, others add it on to the daily activity calories which means you probably should not be comparing activity calories across devices.
If there is one metric you can trust is the activity session calories. Most devices agree that the Keytel formulation for energy expenditure during exercise is the gold standard. This method takes your heart rate over resting heart rate during your activity as a proxy for oxygen consumption and derives calorie burning from it.
While we don’t have a calorimeter device to compare how truthful this is, this should be consistent on all of your watches.
References
Keytel, L. R., Goedecke, J. H., Noakes, T. D., Hiiloskorpi, H., Laukkanen, R., van der Merwe, L., & Lambert, E. V. (2005). Prediction of energy expenditure from heart rate monitoring during submaximal exercise. Journal of sports sciences, 23(3), 289–297. https://doi.org/10.1080/02640410470001730089
Summary questions
Why do my two wearables show completely different calorie counts for the same workout?
Because they're using different underlying algorithms. Devices A, B, E and F rely predominantly on the Keytel HR-reserve formula, device C ranks HR reserve second, and device D leans mostly on motion-derived features like steps and speed. At low intensities they roughly agree, but as the HR-reserve integral rises, device B overestimates versus the Keytel gold standard while motion-based device D consistently underestimates.
Which calorie metric from my watch can I actually trust?
Activity session calories. Across six devices analyzed on datasets ranging from 24,928 to 340,002 sessions, most converge on Keytel-style HR-reserve formulations as the gold standard, with decoded R² values between 0.740 and 0.955. Daily totals and baseline metabolic rate diverge wildly between brands, but the per-session workout number is the most consistent metric to follow.
Why is my baseline metabolic rate so different on each device?
BMR estimates showed the largest disparities of any metric in the analysis — and same-user comparisons ruled out population bias. Device B consistently reports the lowest values (likely true BMR), while devices A and C report higher numbers that probably reflect resting metabolic rate (RMR), which absorbs some non-exercise activity. Device D produces the highest BMR estimates for reasons that remain unexplained.
Should I compare daily total calorie burn across different watches?
No. Some devices bundle passive movement into your baseline metabolic rate, while others add it on top as non-exercise activity thermogenesis (NEAT), so the daily totals aren't measuring the same thing. Only device B's NEAT was mainly explained by activity minutes, consistent with reporting true BMR — the rest mix these components differently.
How do wearables estimate the calories I burn just moving around during the day?
They model NEAT primarily from steps and distance — those were the top SHAP features across most devices. However, the decoding R² for NEAT (ranging from 0.384 for device C to 0.937 for device D) is lower than for workout calories, because small movements like fidgeting register on accelerometers but don't show up in step counts or heart rate.
Is the Keytel heart-rate formula actually the gold standard for calorie burn?
It's the most widely adopted approach — four of the six devices analyzed (A, B, E, F) are predominantly driven by it, and it's grounded in physiology by using HR above resting as a proxy for oxygen consumption. The formula factors in weight, age and sex separately for men and women. Without a calorimeter comparison we can't verify absolute accuracy, but it will at least be internally consistent across any watch that uses it.
Does a motion-based calorie algorithm underestimate my workouts?
In this analysis, yes. Device D, which relies more on motion-derived features than HR reserve, consistently predicted lower calorie expenditure than the Keytel HR-reserve gold standard, and the gap widened as cardiovascular effort increased. For high-intensity sessions where heart rate rises faster than movement intensity, motion-based estimates tend to miss the true metabolic cost.
If I own multiple wearables, which one should I follow for calories?
Probably none of them exclusively — or all of them, in context. The largest cross-device disagreements come from BMR estimates and how NEAT is bundled, so daily totals aren't comparable. Stick to per-session activity calories from a device using HR-reserve methodology, and treat that number as your consistent reference rather than mixing metrics across brands.