We use cookies to enhance your browsing experience and analyse our traffic. By clicking “Accept All”, you consent to our use of cookies according to our Cookie Policy. You can change your mind any time by visiting out cookie policy.
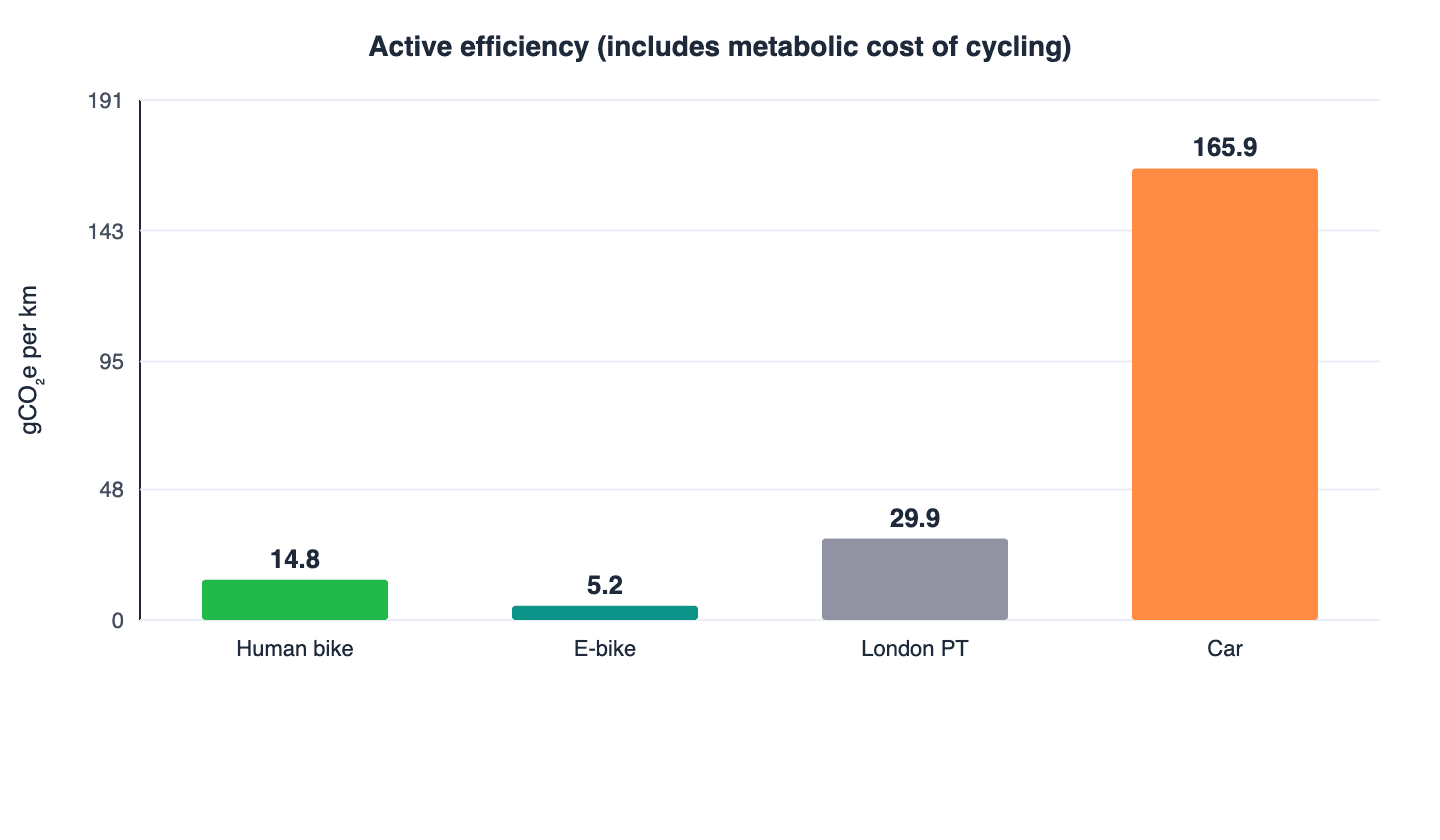
An e-bike out-emits your legs, in reverse. Powering a bike with food-fueled muscle costs about 14.8 gCO₂e per km, versus 5.2 g for an e-bike's metabolic effort plus grid electricity.
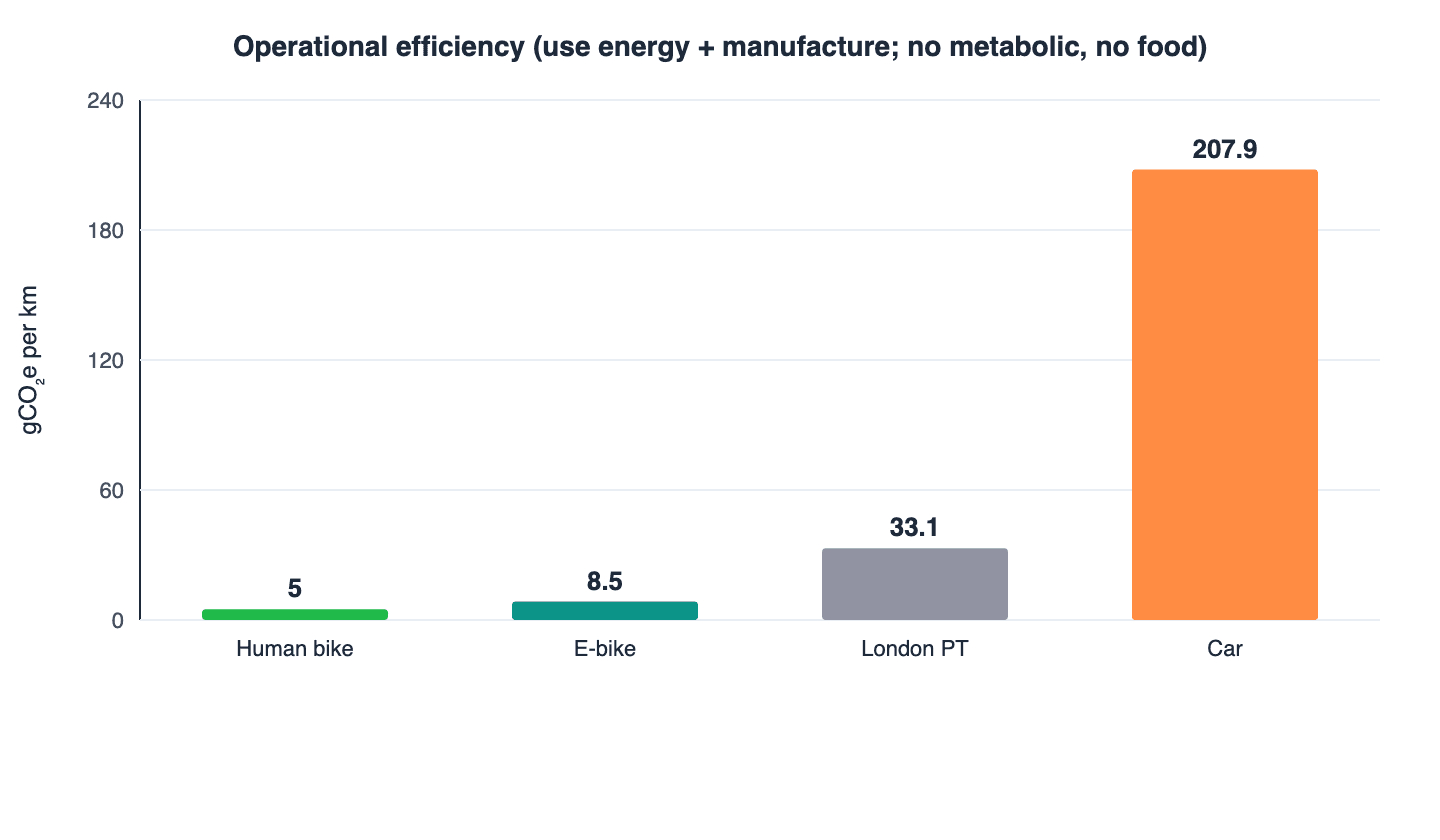
The car is in a different league. All-in, driving costs about 208 gCO₂e per km against 33 g for London public transport and 5 to 8.5 g for either bike.
Food is the swing factor. If a rider replaces every burned calorie with an average diet, the ordinary bike's footprint jumps from 19.8 to 81.6 g per km and can exceed public transport.
A few weeks ago, I analyzed which forms of commuting were most time-efficient in London, and cycling came out on top most of the time. I stated that it’s not only quicker but also healthier and more environmentally friendly, which elicited the response, "How do you know that?” Well, I must admit, I didn’t know for sure for those routes. So, I thought, let’s find out. It also led me to look into the fascinating question of whether human-powered cycling or e-biking is actually more efficient, and what “efficient” even means when one option runs on food and muscle and the other on a mix of pedaling and grid electricity.
What I ended up investigating was not the question of “Is this better for the environment?” but instead, “What is the efficiency of the different modes of transport in terms of CO₂ emissions?”
Bear with me; I am not a climate scientist, and I’m doing my best job at an analysis using publicly available information. All feedback on my methods, assumptions and sources is greatly appreciated. I use greenhouse-gas intensity as CO₂e (carbon dioxide equivalent) as a common yardstick of energy cost per kilometer. That makes the modes broadly comparable, but leaves out particulate pollution, NOx, tyre wear, noise, land use and other environmental effects.
The two parts to efficiency
I looked at the same 10 London morning commuting corridors in two ways:
Active efficiency. The cost of doing the journey. For bikes, that is metabolic CO₂ from the extra exercise calories (and for e-bikes, that is the metabolic cost plus UK grid electricity for the motor). For cars and London public transport, it is the DESNZ 2026 operating intensity. Metabolic CO₂ here is a measure of how hard the body is working on the ride, not a claim that breath is “bad carbon” in an inventory sense. Exhaled CO₂ is biogenic (short-cycle carbon from food), while food production and fossil/grid energy are what usually matter for climate accounting. I’m also ignoring basal metabolic energy here.
Operational efficiency. The system cost of providing the journey: tank-to-wheel/grid use plus amortized vehicle manufacturing. An unassisted bike has no exhaust and no grid draw, but it still has to be built, so manufacture belongs here.
(DESNZ = UK Department for Energy Security and Net Zero; their conversion factors are the standard set used for UK company reporting.)
Figure 1: Active efficiency by mode. Metabolic cost included for cycling; DESNZ 2026 for PT and car.
Get the latest Terra Research reports and insights every week as soon as they're published.
Active efficiency: why the e-bike looks more “efficient”
This is, perhaps, the counterintuitive bit. An e-bike burns grid electricity; a normal bike does not. So why is the e-bike’s active cost lower?
I set mechanical pedaling power to 200 W for human-powered commuting and 50 W for e-bike human input, with the motor making up the remaining 150 W (about 200 W electrical at 75% grid-to-wheel system efficiency, accounting for motor, controller, battery, and drivetrain losses). I converted the human element at 23% gross efficiency (near the top of the commonly reported 18–23% range) with no basal subtraction, so the e-bike’s metabolic term is a quarter of the human-bike term.
To get a per-km value, I divide this by the average speed for each of the 10 corridors ((200 W ÷ 0.23) × 0.860 kcal per Wh ÷ speed (km/h)). The average metabolic cost is the average of each of these. Because I’m holding power as fixed, low corridors cost more per km (e.g. Hackney → City ~11 km/h → ~70 kcal/km), and fast ones cost less (Hammersmith → City ~23 km/h → ~33 kcal/km). This is an inaccuracy, but it allows us to do a direct comparison.
This is a relatively hard-riding scenario, not an average-cyclist estimate. But when I ride around the bike lanes of London, it looks like commuters are pushing pretty hard to me! The 200 W assumption produces about 43 kcal per kilometer across these urban journey times, compared with 11 kcal/km in the ECF’s (European Cyclists’ Federation) standard commuting model.
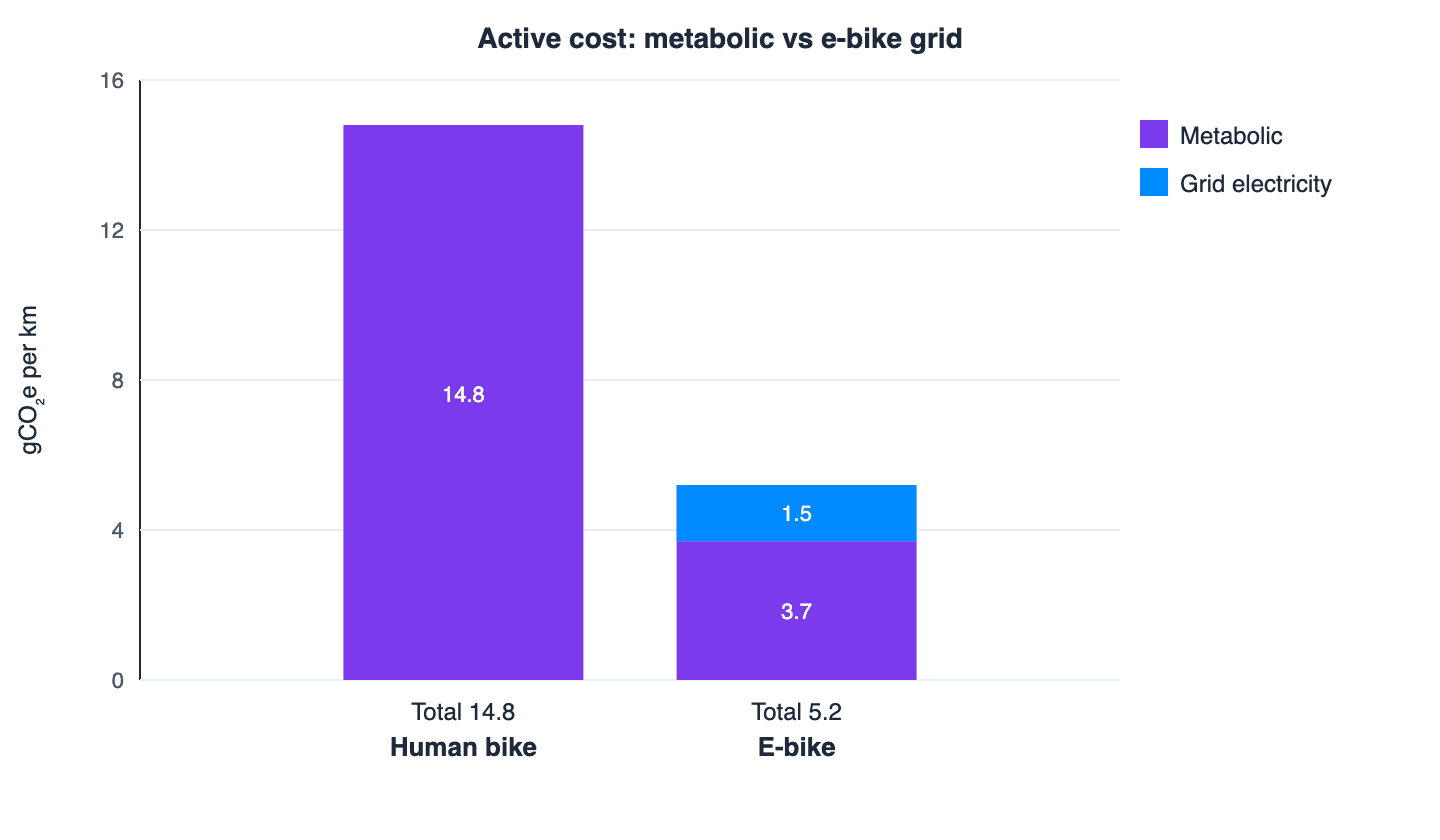
Less pedaling means fewer calories. Fewer calories mean less metabolic CO₂ on the ride: approx. 15 vs 3.7 g/km for human-powered vs e-bike. The UK grid cost of assistance is small by comparison, about 1.5 gCO₂e/km. So, in terms of active efficiency, the e-bike wins because cutting human work to a quarter saves more metabolic cost than the motor adds from the grid (~5.2 g/km total vs ~15 g/km).
Really, all this tells us is that humans are relatively inefficient at turning metabolic energy into motion, but a bicycle remains extraordinarily energy-efficient as a transport system because it moves so little vehicle mass.
Figure 2: Active cost breakdown. Human metabolic effort vs e-bike metabolic + grid.
A one-way Hammersmith-to-City ride (~11.6 km) comes in at about 132 g of active metabolic cost on a human-powered bike, versus ~47 g on an e-bike (metabolic + grid), versus ~346 g of DESNZ operating cost in the public-transport mix, and 1.9 kg for a car.
Operational efficiency: use energy + manufacture
If active efficiency asks how hard the journey is to do, operational efficiency asks what the system costs to provide it. Claiming 0 g/km for an unassisted bike is true only if you ignore that the bike exists. ECF/TNO put ordinary-bike manufacture at about 5 gCO₂e/km (amortized over typical lifetime kilometers); an e-bike is about 7 g/km. I add manufacture for the other modes too: roughly 3 g/km for the PT mix and 42 g/km for a car (ECF/ADEME).
Use-phase factors are the DESNZ gCO₂e/km for energy used while traveling (exhaust, traction electricity, or e-bike grid). I used data from the DESNZ 2026: e-bike grid 1.5 g, PT blend 29.9 g, car tank-to-wheel 165.9 g. An unassisted bike’s use-phase factor is 0.
That gives operational totals of about 5 / 8.5 / 33 / 208 gCO₂e/km for human bike, e-bike, London PT, and car. Bikes stay an order of magnitude more efficient than PT; the car is still in a different league.
Figure 3: Operational efficiency. Use energy plus amortised manufacture (no metabolic, no food).
Food carbon intensity (after manufacture)
Manufacturer answers, “What did building the vehicle cost?” The next lifecycle question for cycling is food: if you burn those ride calories and replace them with more food, that food has a production footprint.
The ECF’s 1.44 gCO₂e/kcal factor is an average European diet intensity (roughly annual diet footprint ÷ calorie intake), not necessarily the marginal footprint of whatever someone eats because they cycled. If they are a carb-loving athlete, this could be at the lower end of the spectrum; if our commuters are meat-loving carnivores, it could be much more.
Under this hard-ride scenario (~43 kcal/km on the human bike; ~11 on the e-bike), a 100% calorie-replacement food term is about 62 gCO₂e/km for the human bike and ~15 g for the e-bike. Of course, if the commuter doesn’t eat anything extra, this is zero.
At zero replacement, the ordinary bike wins on that expanded add-on. With fairly modest replacement, the e-bike wins. At full replacement in this model, the human bike can also exceed the public-transport use-phase estimate. Food is where bike-vs-e-bike rankings become assumption-heavy, unlike the clearer active and operational pictures above.
Totals
To calculate a total “efficiency number” for public transport and car, I didn’t just add “active” and “operational” together. Active is the DESNZ use-phase intensity (the cost of actually making the trip). Operational starts from the same use-phase figure and only adds amortized vehicle manufacturing. Adding active to operational would double-count the journey’s energy.
For bikes, I purposely separated them out: active is mostly metabolic effort (plus e-bike grid), while operational is manufacturing (plus that same grid). The combined total includes both, counting the grid only once, and optionally food on top.
Mode
Total gCO₂e/km
Human bike, 0% food
19.8
Human bike, 100% food
81.6
E-bike, 0% food
12.2
E-bike, 100% food
27.7
London PT
33.1
Car
207.9
Table 1: All-in average (gCO₂e/km). Metabolic/use + manufacture + food (bikes only). Bike 0% = metabolic + manufacture [+ grid on e-bike]; 100% adds diet. PT/car = use-phase + manufacture.)
The Method
Distances come from the same top London morning corridors used in the bike-vs-TfL-vs-Google analysis (weekday outdoor rides, roughly 7–9 am). To isolate intensity, I applied every mode’s factor to the recorded bike distance, so these are standardised equal-distance comparisons, not mode-specific route lengths. Real car, bus and Underground routes between the same points can differ. The DESNZ car factor is an average UK kilometer; it does not specifically account for London congestion, idling or cold starts.
Car: DESNZ 2026 average car, unknown fuel. 165.91 gCO₂e/km tank-to-wheel; plus 42 g/km manufacturing in the operational total; 43.99 g/km well-to-tank is upstream fuel supply (not in the operational headline above). Single occupancy.
London public transport: 70% Underground + 30% London bus using DESNZ 2026 factors (15.49 and 63.60 g/passenger-km, 29.92 g blend), plus 3 g/km vehicle manufacture in the operational total. A public-transport mix, not “Tube only.” Underground: 15.49 gCO₂e/passenger-km. London bus: 63.60
Bikes:200 W / 50 W mechanical pedaling; metabolic = mech ÷ 0.23 (basal not included); active = metabolic (+ e-bike grid 1.5 g/km); operational = e-bike grid + manufacture (5 / 7 g/km ECF); food at 1.44 gCO₂e/kcal. Gross efficiency 23% and 75% grid-to-wheel are assumptions and should be treated as such.
Takeaway
For the most popular cycling-commuting corridors in London, unsurprisingly, the car is the big loser. In terms of active efficiency, an e-bike looks better than an unassisted bike because the motor replaces much of the human effort with a little grid electricity. On operational efficiency (once manufacturing is included), both bikes remain tiny compared to public transport or a car (about 5–8.5 g vs 33 g vs 208 g).
Public transport comes out lower than I expected, but I have to give some big caveats: equal bike distance (real PT routes can be longer), the 70/30 mix is an assumption, and Tube-only would be about 15g and bus-only would be more like 64g.
The interesting human point is how inefficient we are at converting carbon-based matter into mechanical energy (in the form of movement) compared to an electric motor. Food production can change the bike-vs-e-bike story depending on how many extra calories you actually replace.
So cycling wins all round. And if electric assistance is what turns a car journey into a bike journey, or lets someone cycle farther and more often, it is an exceptionally efficient use of energy.
Is cycling actually more environmentally efficient than driving in London?
By a wide margin. Across the 10 London morning commuting corridors analyzed, a human-powered bike totals about 19.8 gCO₂e/km all-in (including manufacture and metabolic cost, excluding food), an e-bike about 12.2 g/km, London public transport 33.1 g/km, and a single-occupancy car 207.9 g/km. The car is roughly 10x worse than either bike and 6x worse than public transport.
Why does an e-bike look more efficient than a regular bike?
Because humans are inefficient energy converters. At 200W of pedaling on a human-powered bike vs 50W on an e-bike (with a 150W motor at 75% grid-to-wheel efficiency), the metabolic CO₂ drops from about 15 g/km to 3.7 g/km, while the grid only adds ~1.5 g/km. Cutting human work to a quarter saves more metabolic carbon than the motor consumes — active cost falls from ~15 g/km to ~5.2 g/km.
Does an unassisted bike really have zero emissions?
No — that's only true if you ignore that the bike had to be built. Using ECF/TNO figures, ordinary bike manufacture amortizes to about 5 gCO₂e/km over its lifetime, and e-bikes about 7 g/km. Compare that to 3 g/km for the PT mix and 42 g/km for a car, and bikes still win by an order of magnitude on operational cost.
How much does the food I eat to fuel my ride actually matter?
It's the assumption-heavy part of the calculation. Using the ECF's 1.44 gCO₂e/kcal European diet average and a hard-riding scenario (~43 kcal/km on a regular bike, ~11 on an e-bike), 100% calorie replacement adds ~62 g/km for the human bike and ~15 g/km for the e-bike. If you don't eat extra to compensate, this is zero — but at full replacement, the human bike can actually exceed London PT's use-phase estimate.
Should I choose an e-bike or a regular bike to minimize my carbon footprint?
It depends on whether you eat more to compensate for the ride. At 0% calorie replacement, the human bike wins at 19.8 g/km vs 12.2 g/km — wait, actually the e-bike wins at both 0% and 100% replacement (12.2 and 27.7 g/km vs 19.8 and 81.6 g/km for the human bike). The regular bike only beats the e-bike when you factor out both grid electricity and food entirely.
How does London public transport compare to cycling?
PT lands at about 33.1 gCO₂e/km using a 70% Underground / 30% bus mix (Underground alone is just 15.49 g/passenger-km, but buses are 63.60 g). That's roughly 4-7x more than either bike option, but still 6x better than a single-occupancy car at 208 g/km. Tube-only commutes would be nearly as clean as cycling with full food replacement.
How much CO₂ does one commute actually produce?
For a Hammersmith-to-City ride (~11.6 km), the active metabolic cost is about 132 g on a human-powered bike versus 47 g on an e-bike (metabolic + grid). The same trip costs about 346 g in the London public-transport mix and 1.9 kg by car — meaning the car produces roughly 14x more carbon than the human bike ride and 40x more than the e-bike ride for the same journey.
Does replacing a car trip with an e-bike ride really make a big difference?
Yes — enormously. A car emits about 208 gCO₂e/km operationally, versus 8.5 g/km for an e-bike including manufacture and grid electricity. That's a ~96% reduction per kilometer. If electric assistance is what turns an otherwise-driven trip into a cycled one, or extends the range someone is willing to ride, it's one of the most efficient uses of grid electricity available in urban transport.