We use cookies to enhance your browsing experience and analyse our traffic. By clicking “Accept All”, you consent to our use of cookies according to our Cookie Policy. You can change your mind any time by visiting out cookie policy.
Temperature has long been the go-to for tracking the menstrual cycle with wearables, but it turns out your body offers plenty of other clues. In this post, we show that heart rate, breathing rate, and HRV all follow a monthly rhythm driven by progesterone. Using a simple model trained on these signals alone, we can predict cycle phase with 89% accuracy, opening the door to temperature-free cycle tracking.
Heart rate, breathing rate, and HRV all follow a hidden monthly rhythm — driven by progesterone after ovulation, these signals shift in sync with the menstrual cycle, producing autocorrelation profiles that mirror temperature's well-known ~28-day pattern.
A simple model predicts cycle phase with 89% accuracy using no temperature at all — by feeding 30 days of smoothed physiological signals into a logistic regression, we can reliably classify luteal vs. follicular phase, with breathing rate emerging as the single most informative feature.
The approach generalizes across wearable devices — when tested across a range of wearables, the model still achieves 80% accuracy, suggesting these physiological rhythms are robust enough to enable temperature-free cycle tracking on any device.
Have you ever opened your wearable app and wondered why your resting heart rate is creeping up, your breathing rate slightly higher at night, your HRV dipping, even though you didn’t change your routine?
There’s a subtle rhythmic pattern behind this, even if you don’t see it directly.
In our previous post our cycle tracking, we explored how wearable metrics shift across the two main phases of the menstrual cycle. The big picture was clear: the follicular and luteal phases differ consistently in temperature, nighttime heart rate and breathing rate, HRV, and even sleep quality.
Temperature-based menstrual cycle tracking is the gold-standard in wearables because basal temperature shifts are a well-established marker of ovulation and therefore the transition from follicular to luteal phases [1]. But this raises an interesting question:
Are heart rate, breathing rate, and HRV cycling in a way that allows us to infer menstrual cycle phase even without temperature?
Why These Signals Move Together
As we looked at in the previous blog, temperature has an autocorrelation profile that peaks at ~28 day intervals. This lines up well with typical menstrual cycle lengths and suggests that the cycle acts as a hidden rhythm shaping our biology. But are other signals shaped by this same rhythm?
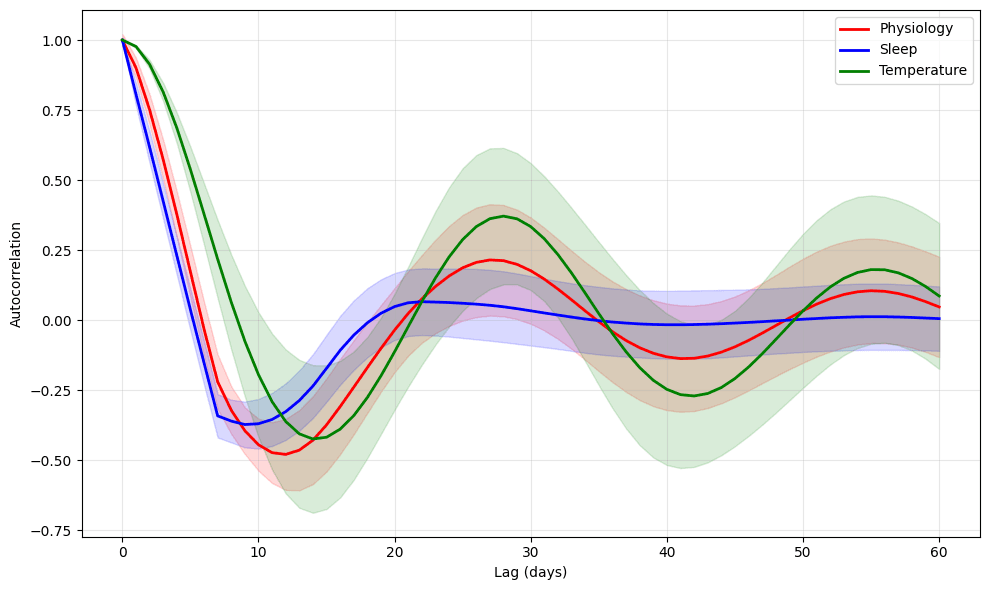
It turns out many of them do. Physiological signals (heart rate, breathing rate, and HRV) all show a clear monthly rhythm, meaning they’re influenced by the menstrual cycle too. This explains the lower HRV, higher HR and breathing rates we explored in the last blog. After the LH hormone surge triggers ovulation, there is a period of high progesterone levels as we prepare our body for egg implantation. Progesterone acts on the hypothalamus thermoregulatory centers, causing our temperature to rise and, to support heat transport, our resting heart rate increases as well. Progesterone also shifts the autonomic nervous system towards sympathetic dominance and acts as a central respiratory stimulant, which causes our breathing rate to increase at night and our HRV to drop. All of these signals fluctuating monthly give the average autocorrelation profile below that cyclical shape similar, although slightly weaker, than temperature.
Sleep metrics have a slightly different behavior. Although the menstrual cycle can impact the quality of sleep, causing lighter and more fragmented sleep during the luteal phase for some women, they are not ‘regulated’ by this latent rhythm. Sleep patterns are mostly weekly, and the autocorrelation profile flattens out in time.
The question that remains is, can physiology, independently from temperature, encode our monthly menstrual cycles?
Figure 1: Mean autocorrelation profiles for temperature, sleep metrics, and physiological metrics. Temperature and physiological metrics (HR, HRV and Breathing rate) have monthly rhythms, corresponding to the menstrual cycle. Sleep has a flat autocorrelation after the initial dip, so it does not encode monthly phase.
Get the latest Terra Research reports and insights every week as soon as they're published.
To train a model that can predict whether a specific day corresponds to the luteal of follicular phase, we first generated these labels using the temperature profiles. When temperature stays elevated above baseline for 3 or more consecutive days, we label the period as luteal, and everything else is labelled as follicular. This sustained temperature elevation matches the expected post‑ovulatory temperature rise driven by progesterone. [1].
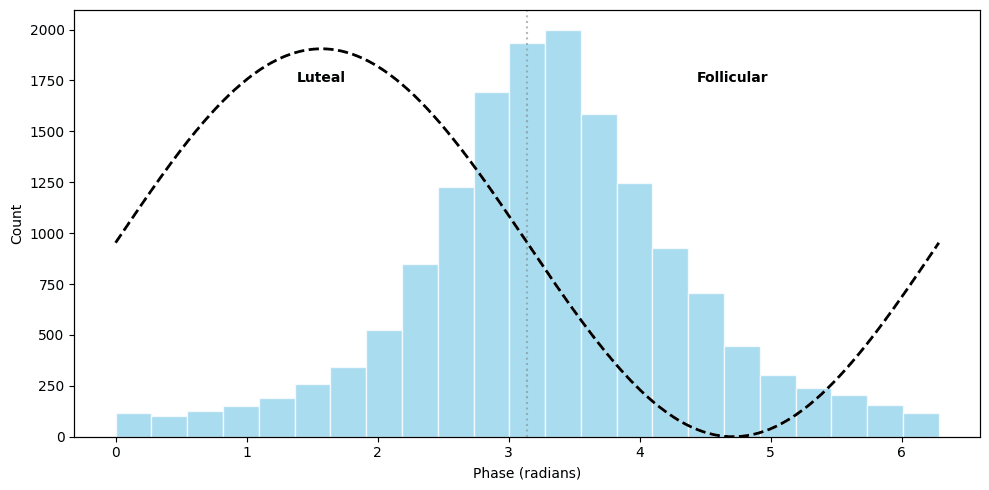
To check that temperature is a reliable signal to generate these labels, we compared the self-reported menstruation dates with temperature-based phases. In other words, we checked where your temperature says you are in respect to your cycle at the start of your period. The alignment was exactly what we’d expect: most reported starts of menstruation line up with the drop in temperature seen during the transition from the luteal to follicular phase.
Figure 2: Menstruation start dates in respect to the temperature profile. The majority of menstruation starts align with the drop of temperature as the body transitions from luteal to follicular.
Testing Cycle Prediction Without Temperature
We use a simple logistic regression to tell us if these physiological signals alone can tell us about phase. We smoothed heart rate, breathing rate, and HRV with a 7-day rolling average, computed rolling z-scores across 30 days and gave the model the previous 30 days of data as input for each time point.
To evaluate the performance we use a modified accuracy metric that allows 2 days of error around phase transitions. The model achieved a median accuracy of 89% per user on a held-out test set.
Breathing rate turned out to be the most informative signal, and the model relied heavily on information of the current day, a week ago, two weeks ago and a month ago.
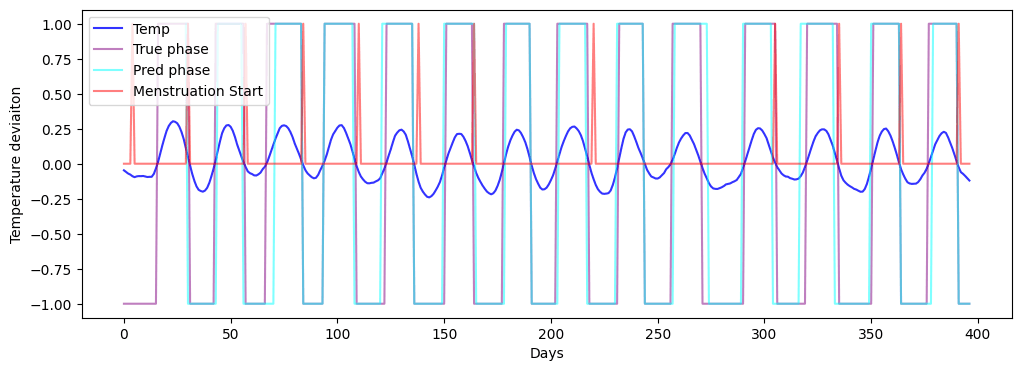
Figure 3: Visualization of model performance in predicting luteal (1) or follicular (-1) phases. Temperature profile for a randomly selected user is plotted in navy, the self-reported menstruation starts in red, the temperature-derived phase labels in pink and the predicted phases in cyan.
Does This Work With Other Devices?
We tested the model trained on multiple wearable data sets that includes daily urinary hormone measurements (LH, E3G, and PdG metabolites) alongside Fitbit-derived physiology and temperature signals [2].
The dataset is small, so we’re careful not to over-interpret the numbers, but the pattern holds:
The model has a modified accuracy of 80%, this drop in performance is expected from the different sensor placements which can cause data distribution shifts.
When comparing the predicted phases against ground truth hormone-derived phases, modified accuracy drops to 73%.
Temperature-derived and hormone ground truth phase labels agree on 75% of the cases
The drop in performance when we compare against real physiology labels and not temperature derived labels is expected. The model is effectively learning to “reconstruct” the structure of a temperature-profile using other physiological signals and any mismatch between temperature-defined phases and hormone-defined phases will show up as a performance ceiling when you evaluate against hormone ground truth.
The Takeaway
Temperature is the clearest signal and it has the strongest monthly autocorrelation, but you’re not stuck without it. The temperature variations in our body across the menstrual cycle are caused mainly by the progesterone hormone effects. As progesterone prepares our body for fertilization, it impacts not only our temperature, but also our resting heart rate, breathing rate and HRV. As a result, all of these signals have a monthly signal variation that can be used to track our cycles with >80% accuracy!
References
[1] Steward K, Raja A. Physiology, Ovulation And Basal Body Temperature. [Updated 2023 Jul 17]. In: StatPearls [Internet]. Treasure Island (FL): StatPearls Publishing; 2025 Jan-. Available from: https://www.ncbi.nlm.nih.gov/books/NBK546686/
[2] Lin B, Li J Y, Kalani K, Truong K, Mariakakis A. mcPHASES: A Dataset of Physiological, Hormonal, and Self-reported Events and Symptoms for Menstrual Health Tracking with Wearables (version 1.0.0). PhysioNet. 2025. RRID:SCR_007345. Available from: https://doi.org/10.13026/zx6a-2c81
Summary questions
Can wearable data predict my menstrual cycle phase without temperature?
Yes. A logistic regression trained on heart rate, breathing rate, and HRV alone achieved a median accuracy of 89% per user in distinguishing luteal from follicular phases on a held-out test set. The model used the previous 30 days of smoothed, z-scored physiology and successfully reconstructed the structure of a temperature-derived cycle without ever seeing temperature itself.
Why does my resting heart rate go up and HRV drop in the second half of my cycle?
After ovulation, progesterone surges to prepare the body for implantation. It raises core temperature via the hypothalamus, increases resting heart rate to support heat transport, shifts the autonomic nervous system toward sympathetic dominance (lowering HRV), and acts as a central respiratory stimulant (raising breathing rate). That's why all these signals move together on a roughly 28-day rhythm.
Which wearable signal is most useful for tracking cycle phase besides temperature?
Breathing rate. In the model, it was the most informative non-temperature signal, with the algorithm relying heavily on values from the current day, one week ago, two weeks ago, and one month prior. This reflects the monthly autocorrelation structure that progesterone-driven respiratory stimulation imprints on nighttime breathing.
Does sleep quality data help predict menstrual cycle phase?
No. While sleep can become lighter and more fragmented during the luteal phase, sleep metrics show a flat autocorrelation profile after the initial dip — meaning they're shaped by weekly rhythms, not monthly ones. Sleep is affected by the cycle but not regulated by it, so it doesn't carry usable phase information for prediction.
How accurate are temperature-based phase labels compared to actual hormones?
Temperature-derived phase labels agreed with hormone-derived ground truth (LH, E3G, and PdG metabolites) on only 75% of cases in the mcPHASES dataset. That's why models trained on temperature labels hit a performance ceiling around 73% modified accuracy when evaluated against true hormonal phases — temperature is the gold standard in wearables, but it's not a perfect proxy for hormonal reality.
Does the model still work on data from different wearable devices?
Mostly. When tested on a Fitbit-based dataset with different sensor placement, modified accuracy dropped from 89% to 80% against temperature-derived labels, and to 73% against hormone-derived ground truth. The drop is expected from data distribution shifts across sensors, but the monthly physiological rhythm is robust enough to generalize.
How were the luteal and follicular labels actually generated?
Days were labeled luteal when temperature stayed elevated above baseline for 3 or more consecutive days, matching the post-ovulatory progesterone-driven temperature rise; everything else was labeled follicular. Validation against self-reported menstruation start dates confirmed alignment — most reported period starts coincided with the temperature drop marking the luteal-to-follicular transition.
Why am I seeing rhythmic shifts in my wearable metrics even when nothing in my routine changed?
Because the menstrual cycle acts as a hidden rhythm shaping your physiology. Temperature, heart rate, breathing rate, and HRV all show clear ~28-day autocorrelation peaks driven by progesterone, meaning your wearable is picking up real hormonal changes — not noise. Those creeping resting heart rate and breathing rate values during the luteal phase are a feature of your biology, not a training or recovery problem.