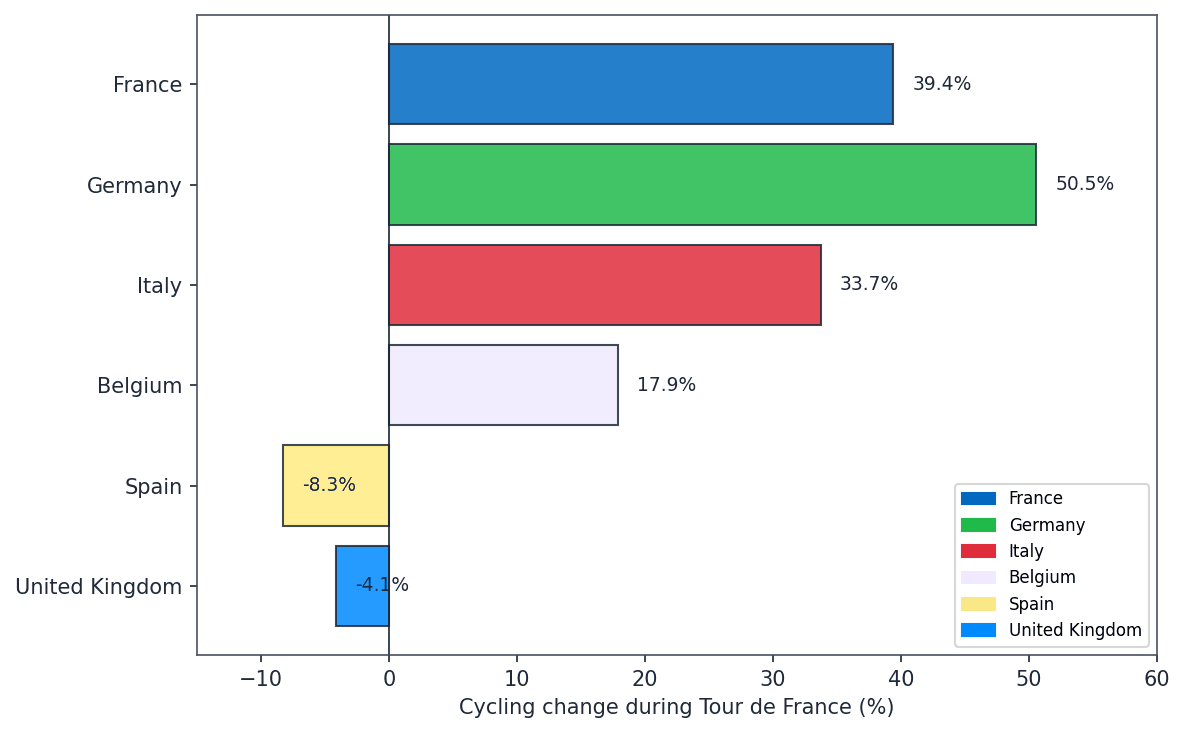
- Pro cycling lifts amateur riding across most of Europe — but not everywhere — outdoor cycling rose 50.5% in Germany, 39.4% in France, 33.7% in Italy and 17.9% in Belgium during the Tour de France (all p ≤ 0.006), while running, walking and hiking stayed flat. The UK and Spain showed no uplift, suggesting the inspiration effect is real but culturally specific.
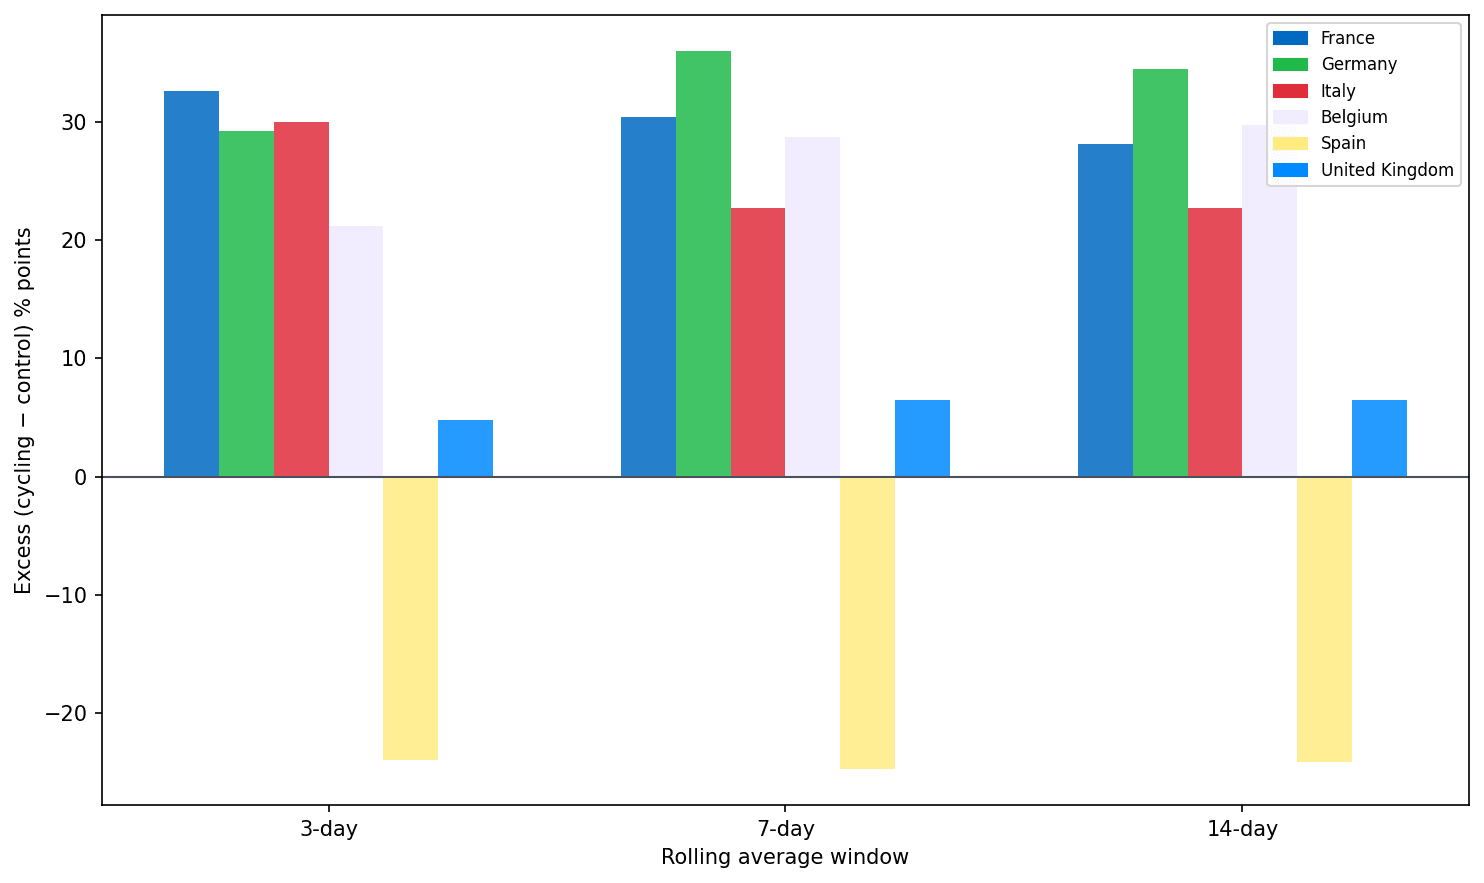
- The effect lasts weeks, not days — under 14-day rolling averages, the cycling-specific excess persisted at +22 to +34 percentage points around event periods in France, Germany, Italy and Belgium. Watching pro cycling doesn't just produce a Saturday-afternoon bounce; it shifts amateur riding behavior across a fortnight.
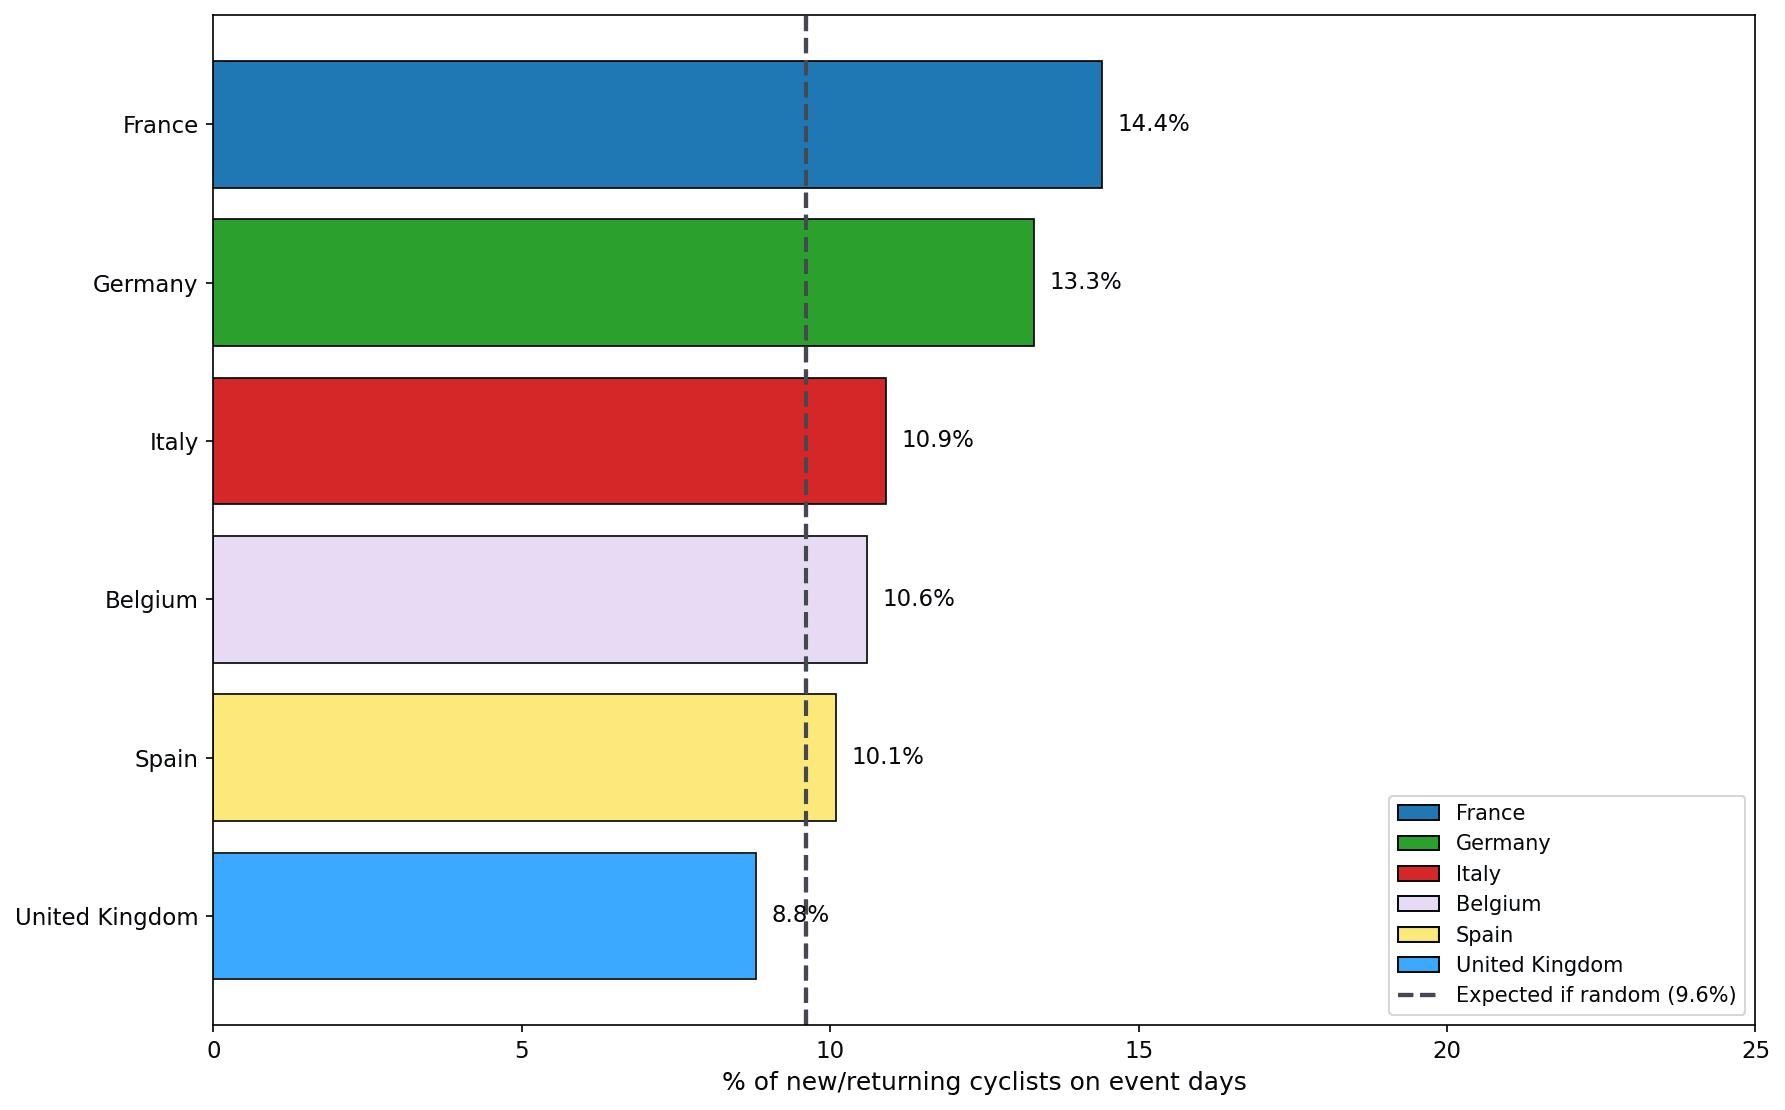
- Big races recruit new and returning riders, not just regulars — first-ever rides and 30-day comebacks were 1.27x more likely on event days across the full dataset, with extreme ratios for individual country–race pairs (5.3x for France during Paris-Roubaix 2024, 3.2x for Tour of Flanders 2024). Major events don't just push existing cyclists out the door — they pull new bodies onto bikes too.
Cycling
Does Watching Sports Inspire Us to Exercise?
Does watching professional cycling actually inspire us to ride? We analyzed ~265,000 outdoor cycling activities to test whether major race weekends produce a measurable spike in everyday riding.
Alistair BrownleeHead of Research
Halvard RamstadEditor-in-Chief
May 14, 2026
Key takeaways
I love watching sports. Whether it’s the Olympic Games, Professional cycling, or anything else going on, I can’t help but feel inspired to head out the door and get active. Anecdotally and emotionally I fully believe in the inspirational value of big sporting events. It felt like the debate around the inspirational value of the London Olympic Games was endless in the UK, and the official figures were inconclusive. But I was a product of the Games coming to the UK. I was inspired as a schoolboy, and in the years following the Games, there were undoubtedly more people cycling on the roads of Yorkshire. So it’s an assumption I hold on to strongly.
Some of the most inspiring events for me are the classics of the professional cycling calendar, kicking off over the next few weeks. So, I wondered, could we find an increase in cycling activity to correspond with these events. For each major pro cycling event—the Monuments (Milan-San Remo, Tour of Flanders, Paris-Roubaix, Liège-Bastogne-Liège, Giro di Lombardia) and the Tour de France. We compared outdoor cycling activity on event weekends to activity on all non-event weekends across 2023 and 2024.
The question is simple: Does professional cycling inspire amateur cyclists to get on their bikes? Or do we simply trade our usual weekend ride for a few hours on the sofa?
We set out to test this using activity data from European fitness tracker users. The results paint a clearer picture than we might expect, comparing cycling on event weekends to all other weekends, with running, walking, and hiking as controls.
How We Set Up the Study
The analysis used activity data from six European countries: the United Kingdom, Germany, France, Italy, Spain, and Belgium. For each major pro cycling event (the Monuments such as Milan-San Remo, Tour of Flanders, Paris-Roubaix, Liège-Bastogne-Liège, and Giro di Lombardia, plus the Tour de France) we compared outdoor cycling activity frequency on event weekends to activity on all non-event weekends across 2023 and 2024.
Crucially, they used running, walking, and hiking as a control. If cycling spikes on event weekends but run/walk/hike stays flat, that suggests an event-specific inspiration effect. If both go up, it could be weather or general weekend activity. The difference between cycling's change and the control's change, which we call the "excess uplift," measures how much of the change is cycling-specific.
For one-day races, the event window was the Saturday and Sunday of the event week, typically when the race is broadcast. For the Tour de France, the window was extended to the full race period plus one day before and after: roughly 23 days per edition, pooled across 2023 and 2024. We also ran multiple-day running means to see if we could detect any impact of different window lengths.
The Tour de France Effect
The long event window used for the Tour de France gives extra power, making the results more reliable. The full race plus one day before and after gives 46 event days versus 685 non-event days.
Germany, France, Italy, and Belgium all show significant increases in outdoor cycling during the Tour de France. In Germany, cycling is 50.5% higher during the Tour period than on other days (p<0.001). In France, it's 39.4% higher (p<0.001). Italy shows a 33.7% increase (p<0.001), and Belgium 17.9% (p=0.006). In each case, the control activity (run/walk/hike) is flat or down, so the effect is specific to cycling.
The United Kingdom and Spain tell a different story. UK cycling is essentially unchanged (-4.1%), and Spain shows an 8.3% decrease. In Spain, control activity actually increases by 14.6% during the Tour, suggesting that when the Tour is on, Spaniards may be doing more running, walking, or hiking, but not more cycling. That could reflect different viewing habits, summer heat driving people indoors or toward cooler activities. The UK result is harder to interpret: perhaps the Tour competes with other summer pastimes, or the sample size is too small to detect a modest effect.
Italy and the Monuments
These effects are plausible but not definitive: with only two event days per race, random variation can easily obscure true effects. The consistency across events and countries, however, suggests something real is going on.
For one-day Monuments, each event contributes only two days (one weekend) per year. That limits statistical power, but the patterns are striking.
- Italy stands out. When all event weekends are pooled, outdoor cycling in Italy is 18.9% higher on event weekends than on non-event weekends, and the difference is statistically significant (p=0.006). Run/walk/hike is essentially unchanged (-0.4%), so the uplift is cycling-specific. It seems Italians ride more when pro cycling is on the calendar.
- Large but non-significant effects appear in several other event–country combinations. Paris-Roubaix 2024 in France shows a 105% increase in outdoor cycling versus non-event weekends, with control activity slightly down. That’s an excess uplift of over 100 percentage points, cycling more than doubles while other activities stay flat. In Germany, Paris-Roubaix 2024 is associated with an 80% increase in cycling (p=0.06, just above the usual significance threshold). Liège-Bastogne-Liège 2024 in Spain shows a 42% increase in cycling, with a 60 percentage-point excess over control. Giro di Lombardia 2023 in Italy shows a 45% increase in cycling, with a 43-point excess.
These effects are plausible but not definitive: with only two event days per race, random variation can easily obscure true effects. The consistency across events and countries, however, suggests something real is going on.
How Long Does the Effect Last?
To test whether the inspiration effect extends beyond the event day itself, the team ran an event study with multiple windows: same day only, ±1 day, ±3 days, ±5 days, ±7 days, and ±14 days around each event. For each window, they compared the mean cycling and control activity in that window to non-event days.
Germany shows a significant excess across all window sizes from ±3 to ±14 days. At ±3 days, cycling excess over control is +12.2 percentage points (p=0.02). At ±5 days, +13.6pp (p=0.004). At ±7 days, +10.0pp (p=0.02). At ±14 days, +11.8pp (p=0.0005). The effect is robust, and it seems like a strong signal
Italy shows significant excess at ±1 day (+18.6pp, p=0.05) and ±14 days (+7.3pp, p=0.04). France and Belgium show large but non-significant excesses across several windows. The UK and Spain consistently show no uplift or negative excess.
A Two-Week Cycling Boost
Daily activity is noisy. To see if the effect persists when we smooth the data, the team computed 3-day, 7-day, and 14-day rolling averages of cycling and control activity, then compared event days to non-event days.
The rolling-average analysis shows even stronger uplift than raw daily counts. Excess (shown in the table below) is calculated as:
Excess = cycling % change − control % change.
Positive values indicate cycling-specific uplift during event periods, and those in bold were significant (p<0.05)
Excess = cycling % change − control % change.
Positive values indicate cycling-specific uplift during event periods, and those in bold were significant (p<0.05)
| Country | 3-day | 7-day | 14-day |
|---|---|---|---|
| France | +32.6 | +30.4 | +28.1 |
| Germany | +29.2 | +36.0 | +34.4 |
| Italy | +30.0 | +22.7 | +22.8 |
| Belgium | +21.2 | +28.7 | +29.7 |
| Spain | −23.9 | −24.7 | −24.1 |
| United Kingdom | +4.8 | +6.5 | +6.5 |
This suggests the inspiration effect is not a one-day spike but a sustained increase in cycling around event periods, visible even when we average over a fortnight.
Get the latest Terra Research reports and insights every week as soon as they're published.
By continuing, I agree to the Privacy Policy and Terms of Service.

Before or After the Race?
Does the uplift come before the event (anticipation) or after (inspiration)? The team compared 7-day and 14-day windows before events to 7-day and 14-day windows after events.
Germany shows more uplift after events than before. We were cheered by this signal because it is what you’d expect to find! In the 7 days after events, cycling excess is +12.6pp (p=0.02). In the 7 days before, it's +6.9pp (not significant). In the 14 days after, +11.0pp (p=0.009); in the 14 days before, +5.8pp (not significant). That pattern is consistent with an inspiration effect: people watch the race, then get on their bikes.
France and Italy show similar patterns, higher excess after than before, though not always statistically significant. The UK shows negative excess in both windows, consistent with lower weekend activity overall.
Do Big Races Recruit New Cyclists?
A separate analysis focused on new and returning cyclists: people whose first-ever cycling activity in the dataset (note: in the dataset!) falls on an event day, or who return to cycling after a 30+ day gap. If events inspire people to start or restart cycling, we'd expect more of these "starts" on event days than expected by chance.
Across the whole data set, 1.27× more new/returning cyclists start on event days than expected. Event days account for 9.6% of the study period, but 12.2% of new/returning starts occur on those days. That's a 27% excess; people are disproportionately choosing to start or return to cycling when pro races are on.
Per-event uplifts vary by country. In France, Paris-Roubaix 2024 shows a 5.3× ratio (observed vs expected), the strongest single-event signal. Weather is, of course, one of the frontrunners for the strongest confounding factor in this analysis, and as Paris-Roubaix is mid-April, we can assume there is a good uplift around this time in European countries due to weather. Tour of Flanders 2024 in France is 3.2×.
In Germany, Paris-Roubaix 2024 is 3.0×, Liège-Bastogne-Liège 2023 is 2.6×. The Tour de France 2024 shows 1.95× in France and 1.70× in Germany. Sample sizes are small (first-time and 30+ day returning cyclists are a minority), but the direction is consistent: events are associated with more people taking up or returning to cycling.
Why the Effect Flips Year to Year
A striking feature of the per-event results is how often significance flips from one year to the next. Giro di Lombardia in Italy shows a 45% cycling uplift in 2023 (p=0.05, significant) but a similar 43% uplift in 2024 fails to reach significance (p=0.08). Spanish users during Giro di Lombardia show the opposite: no significant effect in 2023, but an 85% increase in cycling in 2024 (p=0.017). Using a different methodology (before/after rather than event vs non-event weekends), Paris-Roubaix in the Netherlands shows a 64% cycling increase in 2023 (p=0.011) but a 10% decrease in 2024, a complete reversal.
Several confounding factors could explain this instability. Weather is the most obvious. A rainy event weekend suppresses both cycling and control activity; a sunny one boosts both. When control spikes alongside cycling—as with Giro di Lombardia 2024, where control rose 60–108% across countries —the "excess" cycling uplift shrinks, suggesting good weather rather than race-inspired riding.
Seasonal timing matters too: Milan-San Remo (March) and Giro di Lombardia (October) sit at the edges of the cycling season, when a single warm or cold weekend can swing activity sharply. Sample size varies by country; smaller samples (e.g. Belgium, Spain) produce noisier estimates, so a real effect in one year can vanish in the next purely by chance. Local factors, a national holiday, a competing sporting event, or travel patterns, could also shift behavior in ways we cannot observe.
The control group helps but does not eliminate these issues. When both cycling and control move in the same direction, we cannot cleanly attribute the change to the race. Future work could incorporate weather data, expand the sample, or use multi-year pooling to reduce noise.
What We Found
Do we prove that pro cycling here inspires activity? In short, no. We show it might, and there is some signal that it does. I’m still optimistic; we are looking at a narrow window here - does the Pro Cycling event inspire more cycling activities on the weekends it’s on? It may, of course, inspire much more activity across different modalities and time periods. On a positive note, we could never show that it did not have an effect, that would be akin to proving the absence of nothing!
For researchers, the work shows how fitness tracker data can be used to study behavioral responses to sporting events. The same approach could be applied to other sports, regions, or time periods. We will be doing more of this over the coming weeks.
And for cyclists? The next time you’re tempted to skip a ride and watch the race instead, the data suggests you’re not alone, but in several countries, plenty of people are doing both!
References
- Mölenberg, F. J. M., et al. (2020). Hosting elite sport events to target recreational sport participation: An interrupted time-series analysis. European Sport Management Quarterly. https://doi.org/10.1080/19406940.2020.1839530
- Potwarka, L. R., Drewery, D., Snelgrove, R., Havitz, M. E., & Mair, H. (2018). Modeling a demonstration effect: The case of spectators’ experiences at 2015 Pan Am Games’ track cycling competitions. Leisure Sciences. https://doi.org/10.1080/01490400.2017.1325796
- Reinke, V., John, J. M., Mutz, M., Hilpisch, C., & Jaitner, D. (2026). A systematic umbrella review on the impact of elite sport on participation in physical activity and sport. Frontiers in Sports and Active Living, 8, 1770140. https://doi.org/10.3389/fspor.2026.1770140
- British Cycling.‘Unforgettable’ impact of Tour de France has inspired thousands to get on bikes with British Cycling. https://www.britishcycling.org.uk/about/article/20141203-about-bc-news-Unforgettable-impact-of-Tour-de-France-has-inspired-thousands-to-get-on-bikes-with-British-Cycling-0
- L’Étape du Tour de France. (n.d.). Official site. https://www.letapedutourdefrance.com/en/
Grous, A. (2012). The ‘Olympic cycling effect’: A report prepared for Sky. LSE. https://eprints.lse.ac.uk/47253/1/olympic_cycling_effect.pdf
Methodology
We pooled outdoor cycling activity (road, mountain and general biking, sessions of ten minutes or more) from European fitness tracker users in the UK, Germany, France, Italy, Spain and Belgium across 2023 and 2024. Running, walking and hiking served as a control. If cycling rises on event weekends but the control stays flat, the rise is specific to cycling. The gap between cycling and the control is what we call the excess uplift.
For the Monuments (Milan-San Remo, Tour of Flanders, Paris-Roubaix, Liège-Bastogne-Liège, Giro di Lombardia), the event window was the broadcast Saturday and Sunday. For the Tour de France, it covered the full race plus one day either side. We then reran the comparison across windows of ±1, ±3, ±5, ±7 and ±14 days, and on rolling averages of 3, 7 and 14 days, to see whether the effect persisted beyond race day. Significance was tested at p < 0.05.
One caveat: our sample skews toward people who already exercise, and weather is the biggest unmeasured confounder. That is exactly why the difference between cycling and control, not the raw cycling change, is the metric we trust.
Show moreShow less
Summary questions
- Does watching pro cycling actually inspire people to ride more?
- In four of six European countries studied, yes. During the Tour de France, outdoor cycling activity jumped 50.5% in Germany, 39.4% in France, 33.7% in Italy, and 17.9% in Belgium (all p<0.01), while control activities like running, walking, and hiking stayed flat or declined. That gap between cycling and the controls is the key signal — it's cycling-specific, not just better weather or weekend leisure time.
- Why doesn't the Tour de France boost cycling in the UK or Spain?
- UK cycling was essentially unchanged (-4.1%) and Spain actually dropped 8.3% during the Tour period. In Spain, run/walk/hike activity rose 14.6% during the same window, suggesting Spaniards shift toward cooler or non-cycling activities — possibly due to mid-summer heat. The UK pattern is less clear and may reflect competing summer pastimes or insufficient sample size to detect a modest effect.
- How long does the inspiration effect from a race actually last?
- Longer than a single day. In Germany, the cycling excess over controls was statistically significant across every window tested from ±3 days (+12.2pp) to ±14 days (+11.8pp, p=0.0005). Rolling-average analyses showed sustained 22–36 percentage point excess uplifts in France, Germany, Italy, and Belgium over 3-, 7-, and 14-day windows — meaning the effect is a sustained two-week boost, not a one-day spike.
- Is the uplift driven by anticipation before the race or inspiration after?
- The data points to post-race inspiration. In Germany, cycling excess in the 7 days after events was +12.6pp (p=0.02) versus only +6.9pp (non-significant) in the 7 days before. The 14-day window showed the same asymmetry (+11.0pp after vs +5.8pp before). France and Italy showed similar after-greater-than-before patterns, consistent with people watching the race and then heading out on their bikes.
- Do big races recruit new cyclists or just get existing riders out more?
- Both, it seems. Across the dataset, 1.27× more new or returning cyclists (those starting fresh or coming back after a 30+ day gap) began on event days than chance would predict — event days made up 9.6% of the study period but 12.2% of new/returning starts, a 27% excess. Single-event ratios were even stronger: Paris-Roubaix 2024 hit 5.3× expected in France and 3.0× in Germany.
- Why do results flip so dramatically from year to year?
- Weather is the prime suspect. Giro di Lombardia 2024 saw control activity rise 60–108% across countries, which collapsed the cycling-specific excess — suggesting good weather, not the race, drove much of that weekend's riding. Edge-of-season races like Milan-San Remo (March) and Lombardia (October) are especially vulnerable, and small national samples (Belgium, Spain) add noise. The control group helps but can't fully separate weather from race-inspired riding.
- Can fitness tracker data really detect behavioral responses to sporting events?
- Yes, and this analysis is a proof of concept. Using outdoor cycling activity from six European countries across 2023–2024 — with 46 Tour de France event days versus 685 non-event days — the methodology detected statistically significant, cycling-specific uplifts in four countries while ruling out general weekend effects via running/walking/hiking controls. The same event-versus-non-event framework could be applied to any sport, region, or activity modality.
- Which single race produced the biggest cycling spike?
- Paris-Roubaix 2024 in France, with a 105% increase in outdoor cycling on the event weekend versus non-event weekends — cycling more than doubled while control activity slightly declined, an excess uplift of over 100 percentage points. Germany saw an 80% increase for the same race (p=0.06). The mid-April timing likely combines genuine race inspiration with favorable spring weather, which is a known confounder in this kind of analysis.
Continue reading

Dreaming
What Actually Makes Us Dream?
Why do we remember some dreams and not others? We analyzed over 130,000 nights of sleep to find out what kind of nights, and days, make dream recall more likely.
May 12, 2026
Running
Data Shows Most Runners Don't Actually Get Faster
How do runners actually get faster? We analyzed 856,000 running activities to find out who actually gets faster. It wasn't the intense ones, but rather the consistent ones. Showing up month after month beat everything flashier. Boring, as it turns out, is fast.
May 7, 2026

Marathon Series
The Data Behind the London Marathon
While Sabastian Sawe was busy breaking the two-hour marathon barrier in London, the watches of 571 amateur runners told a quieter but equally fascinating story. GPS devices over-measured the course by 527 metres on average, faster runners ran with higher heart rates than the slower ones did, and Coros watches reported 47% more calories per kilometre than physiology actually supports.
April 27, 2026

London Data
Tube Strikes Made Londoners Active
During the April 2026 Tube strikes, Londoners adapted by cycling more—activity tripled, e-bike commutes rose 13%, and 19% of cyclists were entirely new to riding. Data analysis of 1,566 weekday rides revealed e-bike share jumped from 54.9% to 67.5%, with commutes often staying local. The strikes disrupted transit but highlighted Londoners' resilience in finding alternative ways to move.
April 24, 2026