We use cookies to enhance your browsing experience and analyse our traffic. By clicking “Accept All”, you consent to our use of cookies according to our Cookie Policy. You can change your mind any time by visiting out cookie policy.
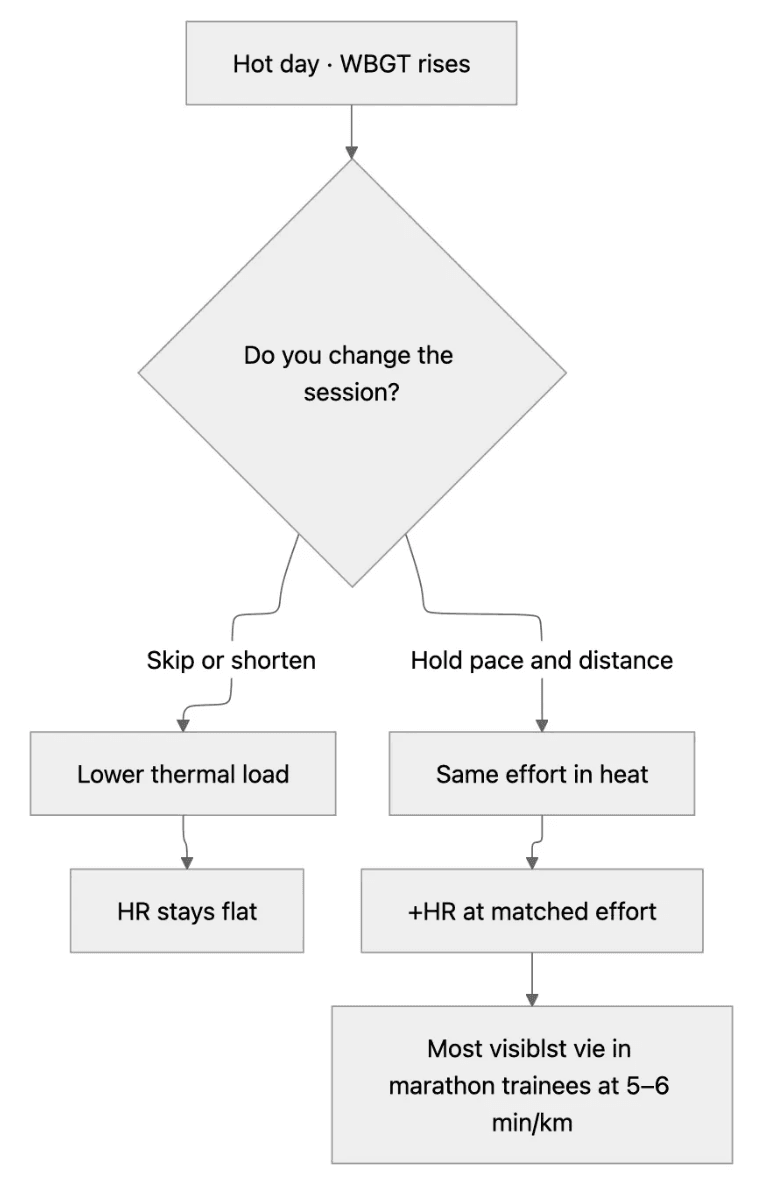
Heat changes what runners do, not how their bodies cope. As WBGT rises, runners slow down and cut runs short, but heart rate at matched effort stays flat.
Runs get shorter before pace slows much. Distance is the most consistent response to heat; pace eases only about 0.66 seconds per kilometer per degree.
The cardiac cost shows up only in runners who push through. Those who hold pace and distance in the heat pay the strain others avoid (Spearman ρ = –0.45).
Why I Switched to WGBT, and What Changed
I love getting feedback on my blogs, mostly because it demonstrates that people are actually reading them. But also because it helps move the analysis on. After last week's research, a few people rightly pointed out that looking at air temperature alone was only telling part of the story. Heat stress on the body isn’t just about the number on the thermometer.
Humidity, wind, and especially the radiant heat from the sun all change how it actually feels when you’re working hard. So I decided to switch the main predictor in our models to Wet Bulb Globe Temperature (WBGT) and re-ran everything on the Terra data.
Get the latest Terra Research reports and insights every week as soon as they're published.
WBGT is the standard method researchers and sports governing bodies use to quantify heat stress (or thermal load) on the human body during physical activity in direct sunlight.
It combines four factors that affect how hot you feel and how much strain your body is under: air temperature, humidity, wind speed, and radiant heat from the sun (including cloud cover and reflections off surfaces).
The wet-bulb part captures evaporative cooling and is heavily influenced by humidity.
The black globe measures radiant heat load from the sun and sky.
The dry-bulb is the ordinary air temperature.
I estimated WBGT for every outdoor run session using data from the Open-Meteo API. Relative humidity and dew point feed the wet-bulb calculation (via Stull’s approximation), shortwave radiation and wind speed help proxy the globe temperature, and I kept a simple rain flag as a control variable.
It’s not a perfect on-site measurement with a physical tripod, but it’s a practical estimate that captures far more of the real thermal stress than air temperature alone.
You may have noticed actual WBGT devices on the sidelines of football matches and athletics tracks, the tripod with the distinctive black globe. At the 2026 World Cup, those readings are getting attention. In football, FIFA’s current rules are fairly conservative: they’ve made 3-minute hydration breaks mandatory in every half of every match, regardless of conditions.
Only when WBGT hits around 32°C do organizers seriously consider extra precautions or postponing and they don’t shorten matches the way some endurance sports do.
For comparison, the World of Triathlon uses a five-color flag system based on WBGT that is more granular and generally more conservative than football: from Green (< 25.7°C WBGT; low risk) to Black (> 32.2°C WBGT; extreme).
At Red and especially Black flag levels, they can shorten distances (for example, cutting the run leg) or even cancel the event. They also monitor conditions in real time during races and can make decisions mid-event if WBGT climbs, which would be communicated via flags during the bike leg.
What Does a WBGT of 32°C Feel Like?
You can hit WBGT 32°C with air temperatures in the mid-to-high 30s Celsius if humidity is moderate to high and the sun is strong. In drier conditions, you might need air temperatures closer to 40 °C, along with intense solar radiation, to reach the same WBGT. The black globe component is what makes it jump when the sun is beating down and drop when clouds roll in.
This 32°C threshold is actually quite controversial. FIFA uses it as the point where organizers should seriously “consider” extra measures or postponement. But the players’ union (FIFPRO) and many sports scientists argue that meaningful risk starts much earlier, they recommend cooling breaks from 26°C WBGT and postponement considerations from 28°C.
There’s a clear gap between the official governing-body rules and what much of the research community considers safer.
Where the Heat Rules and the Science Disagree
Because high external heat stress is a big problem in elite sport, and I think this week’s data analysis demonstrates why.
I combined two large GPS-matched cohorts: 104,883 runs from six European countries (Jan 2023–Jan 2025) and 25,118 runs from verified marathon trainees (Jan 2025–Jan 2026), every session paired to hourly Wet Bulb Globe Temperature at the athlete's location.
At the population level, again, heat looked harmless. Median heart rate barely moves between cool and hot starts. But the median distance falls by roughly a kilometer. Median pace is slightly slower. Crucially, three-quarters of runners are less likely to train on hot days at all.
The heart rate looks flat because, for those who do train, they change how they train. This is a composition effect, not evidence that heat does not matter. When I hold effort constant, same runner, same pace band, a second layer appears.
In plane words, most people change their behavior most of the time to mitigate the physiological impact of heat. But some don’t, and that is where the problem is.
When Heat Does Change Behavior
1. People Skip
When I classified each runner's heat coping style using daily participation and session-level WBGT slopes. The dominant response is not showing up:
42% skip hot days and slow when they do run
34% skip hot days, but do not systematically slow
Only 15% are "weather invariant," neither skipping nor slowing detectably
Marathon trainees are more skip-heavy than I expected (76% skip-dominant).
2. Runs Get Shorter
This is the strongest and most consistent behavioral signal in my models. With a random intercept per runner, each +1°C WBGT is associated with just over 30m of less running distance.
3. Pace Adjusts Modestly
Pace shifts are real but smaller than the distance. Here, the two datasets showed slightly different responses. Runners from the European data slow slightly at the population level. Those from the marathon training dataset show a weaker within-person pace response because the athletes still logging hot-day sessions are a selected subset, the ones willing to run at all.
My takeaway: heat reliably changes behavior. Skip, shorten, sometimes slow. That is the first line of defense, and for most people, it works; session-average HR stays flat.
When Heat Doesn't Change Behavior
Then there are the runners who maintain training intent despite WBGT: they still log sessions, hold marathon-pace efforts, and do not ease off enough for behavior to absorb the thermal load.
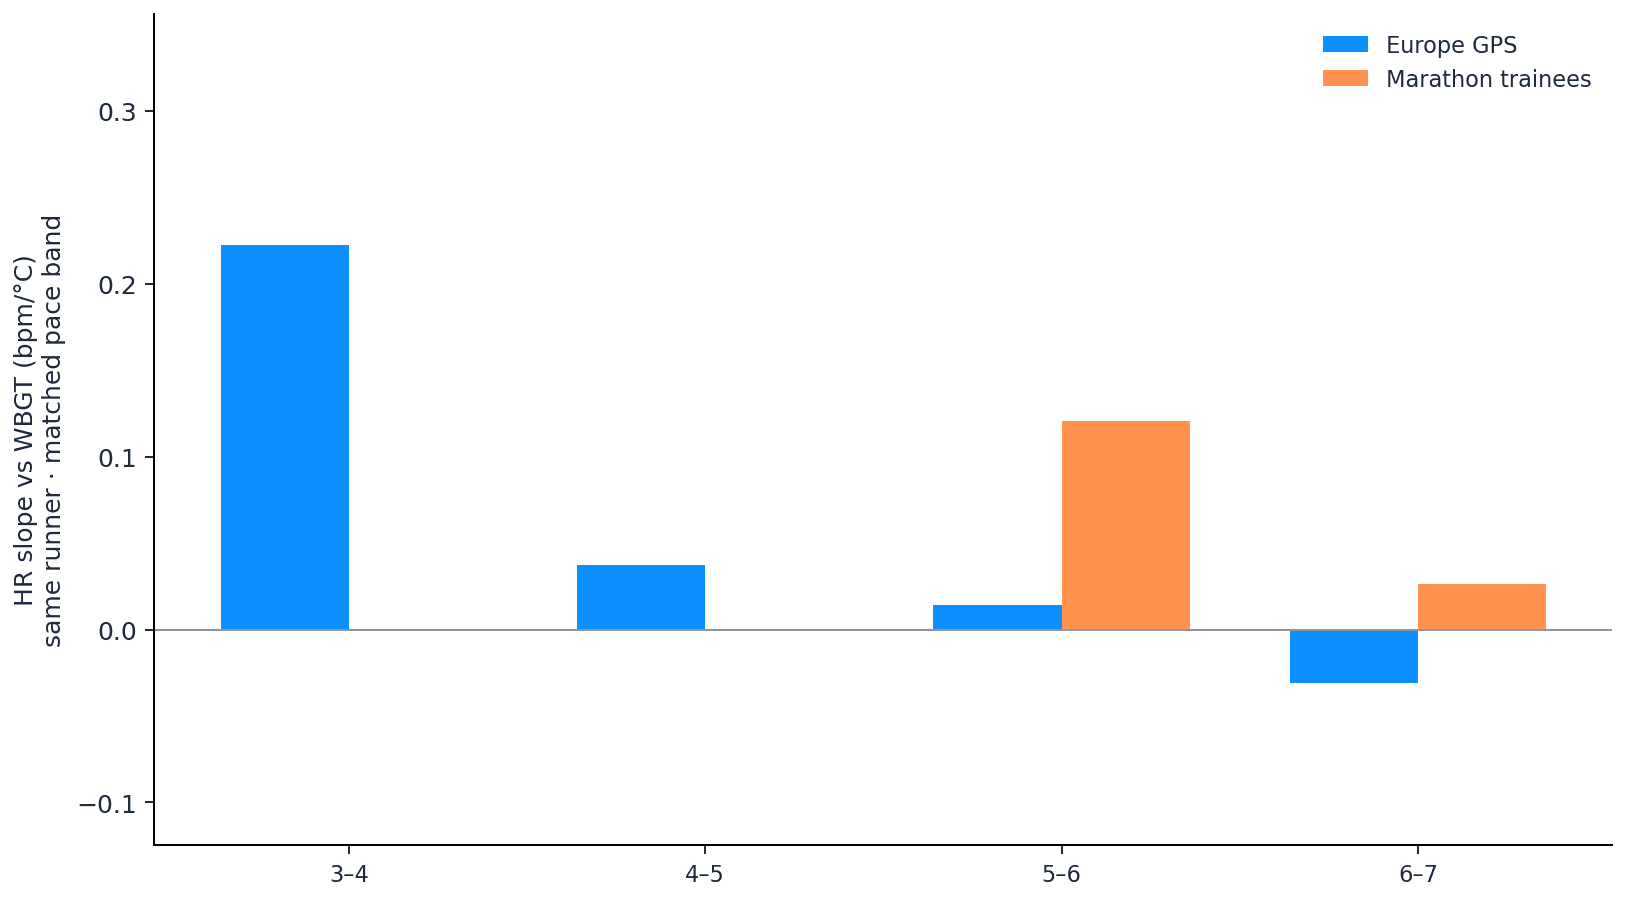
To test whether cardiac strain shows up at constant pace, I fitted a personal HR vs WBGT slope within each pace band (≥4 sessions, ≥2.5°C WBGT spread within the band). Europe recreational runners stay near zero across training paces (median +0.01 bpm/°C in the 5–6 min/km corridor; n = 1,157).
Marathon trainees show a clearer signal at the same effort: median +0.12 bpm/°C (p < 0.01, n = 206), roughly +0.8 bpm per 7°C WBGT, consistent with the population matched-effort estimate of +0.07 bpm/°C. Heat does not stress everyone. It stresses people who keep doing the same kind of run when others would skip or shorten.
Figure 1: Within-person heart-rate response to WBGT when pace is matched.
The Spearman Trade-Off: Behavior and Physiology on the Same Scale
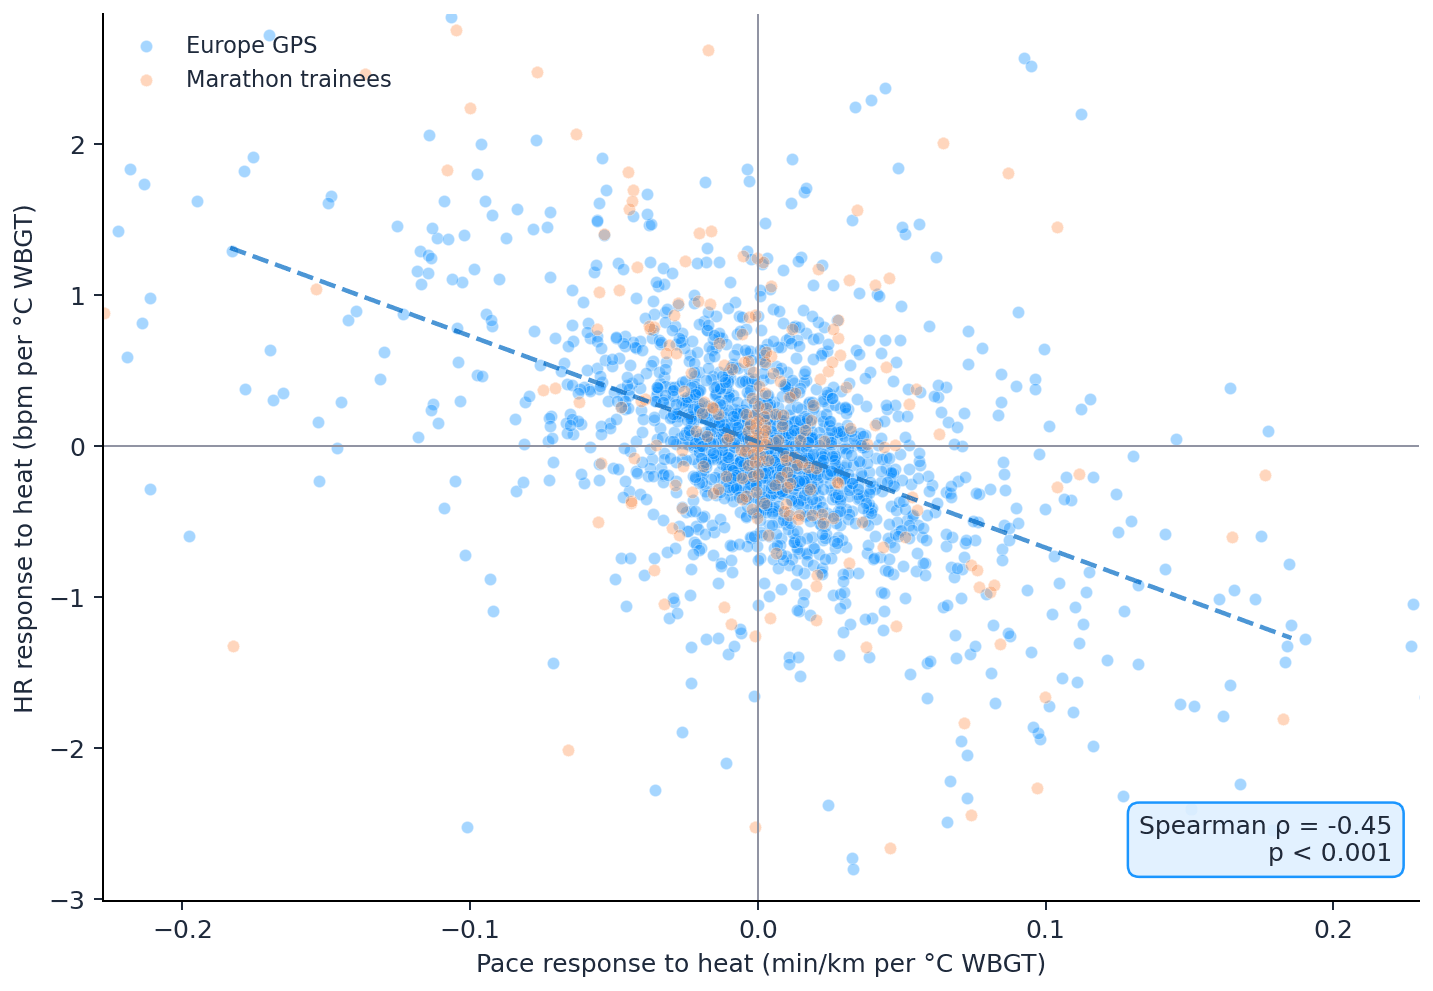
To quantify "slows in heat" vs "HR rises in heat" at the individual level, I estimated each runner's WBGT slopes for pace and HR, then ask: do runners who slow more also show a smaller HR rise?
I used Spearman's rank correlation (ρ), which measures whether two variables move in opposite rank order without assuming a linear relationship
Across 1,996 runners with sufficient hot/cool exposure:
Cohort
Spearman ρ
p-value
Europe Activity
−0.45
< 10⁻⁸⁰
Marathon trainees
−0.43
< 10⁻¹¹
Pooled
−0.45
< 10⁻⁹⁵
This means that runners who rank high on "slows down in heat" tend to rank low on "HR rises in heat", and vice versa. A negative ρ near −0.5 is a moderate-to-strong inverse association. This is a mathematical way of telling us something we already know: if a user eases up in the heat, the heart doesn’t show extra strain. If they don’t ease up, that strain shows up. It’s behavioral thermoregulation working.
Figure 2: Spearman pace–HR trade-off. Each runner's pace slope against their HR slope: less slowing in heat, leads to more HR rise.
What This Means for Running in Heat
None of this is new in principle. Athletes, coaches, race organizers and medical teams already know that heat changes performance and increases risk. But what this analysis adds is scale. Across more than 130,000 real-world runs, the dominant response to heat is not a dramatic rise in heart rate. It is behavior change.
People skip. They shorten. They sometimes slow down. Most of the time, that behavioral adjustment protects the physiology.
The risk sits in the gap between intent and environment. When runners keep the same intensity intent in higher WBGT conditions, especially around common marathon-training paces, the physiological signal starts to appear. The average effect is not huge, but it is consistent: less behavioral adjustment in heat is associated with a greater heart-rate rise.
That is why WBGT matters. Air temperature alone misses too much of the real thermal load. And heart rate alone can miss the behavioral adaptation that came before it. To understand heat properly, we need to look at both: what the environment is doing to the athlete, and what the athlete does in response.
Summary of running heart rate response to WBGT across the sample.
Summary questions
Does running in hot weather actually raise my heart rate?
At the population level, barely. Across 130,001 runs (104,883 European runs plus 25,118 marathon trainee sessions) matched to hourly WBGT, median heart rate stays essentially flat between cool and hot starts. But that's a composition effect — the runners still going out have already shortened, slowed, or self-selected. Heat isn't harmless; most people just quietly change their behavior before physiology has to react.
Why is WBGT a better measure of heat stress than air temperature?
Because WBGT combines four factors that actually determine strain on the body: air temperature, humidity, wind, and radiant heat from the sun, using the formula 0.7 × wet-bulb + 0.2 × globe + 0.1 × dry-bulb. You can hit a WBGT of 32°C at air temperatures in the mid-30s with humid, sunny conditions, or need close to 40°C in dry conditions. Air temperature alone misses the humidity and solar radiation that drive real thermal load — which is why FIFA, World Triathlon, and sports scientists all use WBGT, not the thermometer.
How do most runners respond to hot weather?
They skip. When runners were classified by heat coping style, 42% skip hot days and slow when they do run, 34% skip but don't systematically slow, and only 15% are "weather invariant." Among marathon trainees, 76% were skip-dominant — higher than expected. Not showing up is the single most common defense against heat, not slowing down mid-run.
How much shorter do runs get in the heat?
Distance is the strongest and most consistent behavioral signal in the data. Controlling for individual runner via random intercepts, every +1°C of WBGT is associated with just over 30 metres less running distance. Over a 7°C swing in WBGT, that's roughly a 200m+ reduction — small per degree, but the most reliable adjustment runners make.
Does my heart rate rise if I refuse to slow down in the heat?
Yes, but only if you actually hold pace. Fitting personal HR-vs-WBGT slopes within matched pace bands, European recreational runners showed essentially no effect (+0.01 bpm/°C in the 5–6 min/km band, n=1,157). Marathon trainees holding the same effort showed +0.12 bpm/°C (p < 0.01, n=206) — about +0.8 bpm per 7°C WBGT. Heat stresses the runners who won't ease off, not the ones who adapt.
Is there a real trade-off between slowing down and heart-rate strain?
Yes, and it's mathematically clear. Across 1,996 runners with enough hot/cool exposure, the Spearman correlation between individual pace slopes and HR slopes was −0.45 (p < 10⁻⁹⁵ pooled). Runners who slow more in heat show a smaller HR rise; those who don't ease up pay for it physiologically. It's behavioral thermoregulation working exactly as you'd expect — one lever or the other has to give.
Are FIFA's heat rules strict enough for hot-weather sport?
Many sports scientists say no. FIFA treats WBGT 32°C as the threshold to "consider" postponement and mandates 3-minute hydration breaks per half regardless of conditions. But FIFPRO and much of the research community recommend cooling breaks from 26°C WBGT and postponement considerations from 28°C. World Triathlon's five-flag system, which can shorten or cancel events, is far more granular and conservative than football's.
What's the real takeaway for training in hot weather?
Behavior is the first line of defense, and for most runners it works — skip, shorten, or slow, and physiology stays protected. The risk lives in the gap between training intent and environmental reality: runners who hold marathon-pace efforts in high WBGT are where the +0.12 bpm/°C signal shows up. If you're going to run in heat, adjust the session — don't try to hit the same paces and let heart rate quietly absorb the load.