We use cookies to enhance your browsing experience and analyse our traffic. By clicking “Accept All”, you consent to our use of cookies according to our Cookie Policy. You can change your mind any time by visiting out cookie policy.
Runners slow down as it warms. Pace rose by about 0.009 min/km for every degree above the session-start baseline, a small but statistically reliable drift toward slower running in the heat.
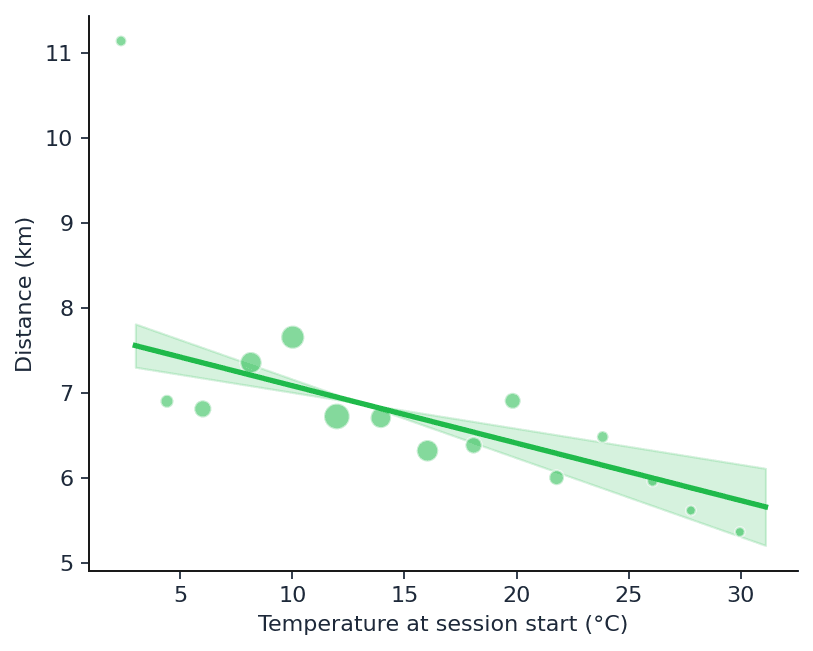
Distance drops alongside pace. Runs fell by roughly 0.067 km per degree, so a warm day pulls down both how fast people go and how far they choose to run.
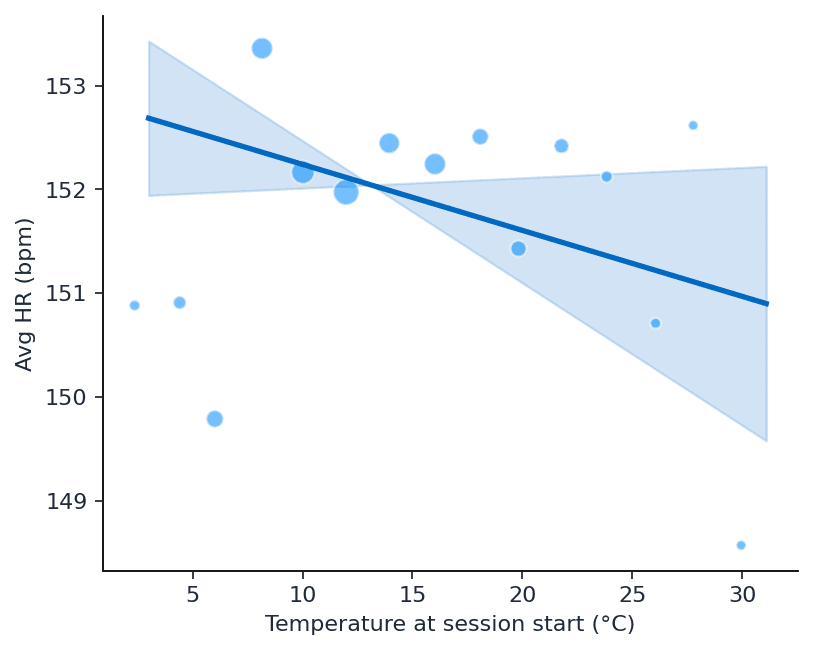
Heart rate stays flat. Average HR barely moved across temperatures, meaning runners aren't paying a higher cardiovascular cost in the heat. They self-regulate, easing off the pace and cutting distance instead of pushing harder.
Warm weather could have many impacts on outdoor running. In general, you’d think that if it’s too hot or too cold, it would reduce activity, with some sweet spot in the middle where people are motivated to head outside for the run or walk.
In my hardcore training days, I went out in all conditions, and many of my worst memories are being many miles from home, wet and freezing cold. But conditions that are too hot may put people off, too, especially “hard” activities such as running. Or, maybe they just make it harder? This may show up in the data as an increased heart rate at a given pace.
Last week’s blog asked the question: Was physical activity impacted by temperature changes in June? This week, I want to see if the data can tell us how running was impacted.
To answer this question, I used a dataset of 3,361 outdoor run sessions by 878 users, recorded between February and May 2026. I lined up each session with hourly temperature data taken from Open-Meteo.
I expected to see runners running at the same pace, but the heat was evident in higher cardiovascular stress, as seen by increased HR at similar paces among individuals. Spoiler: I was wrong!
Method
In all, I used 11 different approaches to ask the same question in slightly different ways. I started with simple cool vs hot descriptives, then moved through increasingly careful ways of separating “who runs” from “how they run”: pooled ordinary Least Squares (OLS), within-person demeaned fixed effects, paired per-user cool/hot comparisons, within-user correlations, and per-runner OLS slopes. To test the heat-stress hypothesis specifically, I used matched pace-band HR, HR residuals, and quadrant analysis.
I checked functional form with non-linear temperature models (linear, quadratic, and cubic), then ran linear mixed-effects models (random intercept per runner) as the strongest single estimate of within-person effects. I made Ridgeline charts as a nice demonstration of the impact of temperature on Pace, Distance and HR. These approaches did not all produce the same p-values (pooled OLS for pace is weak and per-user slopes are noisy), but the direction of effect was remarkably consistent. Which is always nice!
Get the latest Terra Research reports and insights every week as soon as they're published.
My comparison splits sessions into cool (starts below 20°C) and hot (starts at or above 20°C.) Median pace shifts from 6.19 to 6.27 minutes per kilometers. Median distance falls from 5.59 to 5.17 km. Median heart rate moves from 154 to 152 beats per minute: essentially flat.
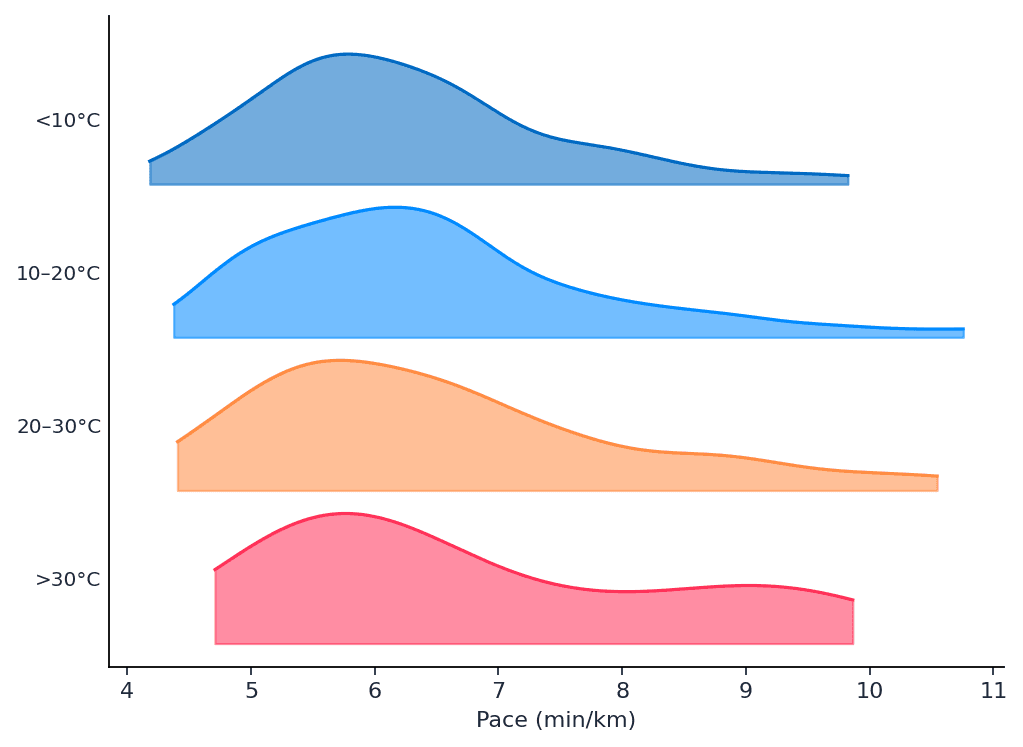
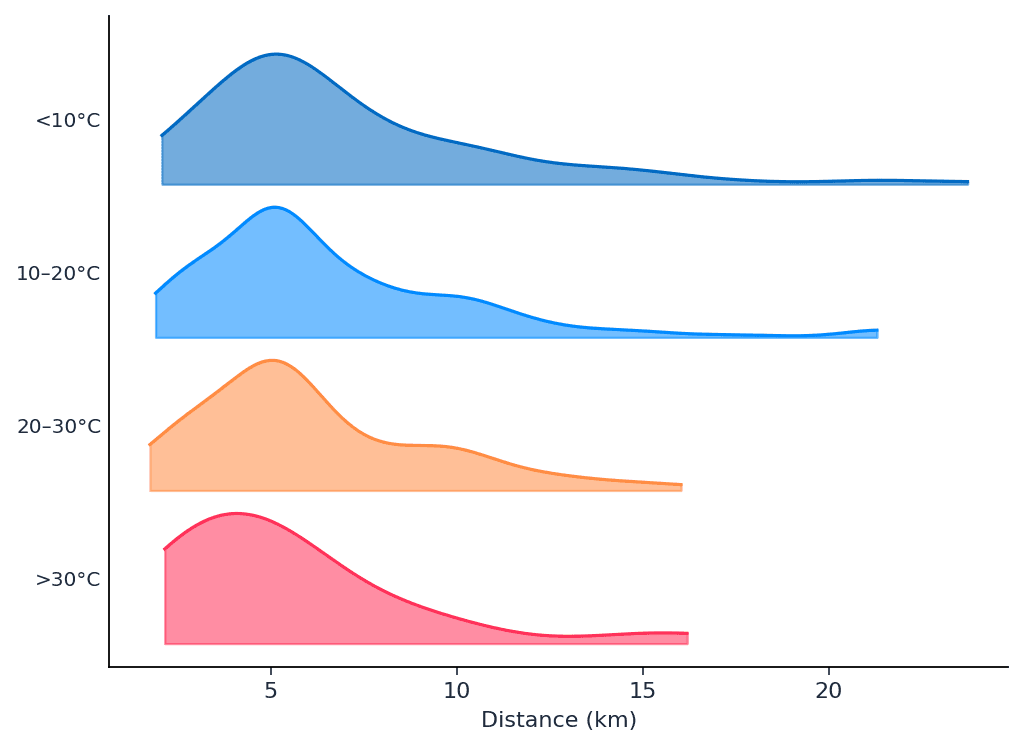
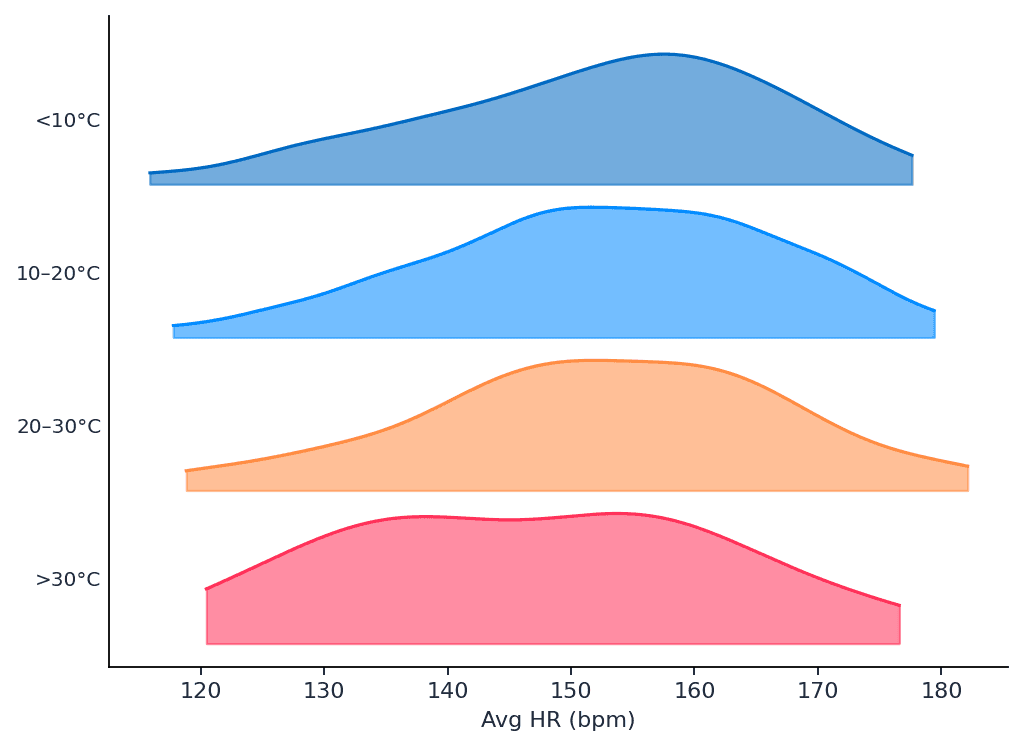
The ridgeline distributions below show more than medians alone. I binned temperature into 4 bins (below 10°C, 10–20°C, 20–30°C, and above 30°C). The pace distribution drifts rightward and runs in clusters at slightly slower speeds. Distance distributions tell a clearer story: the long-run tail that stretches past fifteen kilometers in cool weather shrinks in warmer bins. heart rate distributions overlap heavily across moderate bands.
I think the widening of the curve is interesting here, and could lead to a wider range of user abilities going running these days. That was why I decided to move on to the person-level analysis.
Figures 1-3: Ridgeline distributions to visualize how the user population changes their Pace, Distance and Average Hr of runs in different temperature bins.
Same runners
Perhaps slower people simply run on hot days, creating a false association. I tested this extensively. Pooled regression and within-person demeaned models produce nearly identical pace coefficients, around 0.006 min/km per °C, so the link is not driven by who runs when.
Among sixty-nine runners with enough cool and hot sessions, sixty-one per cent were slower in the heat. Linear mixed-effects models give each runner their own baseline: pace rises by 0.009 min/km per °C (p < 0.001) and distance falls by 0.067 km per °C (p < 1×10⁻⁶).
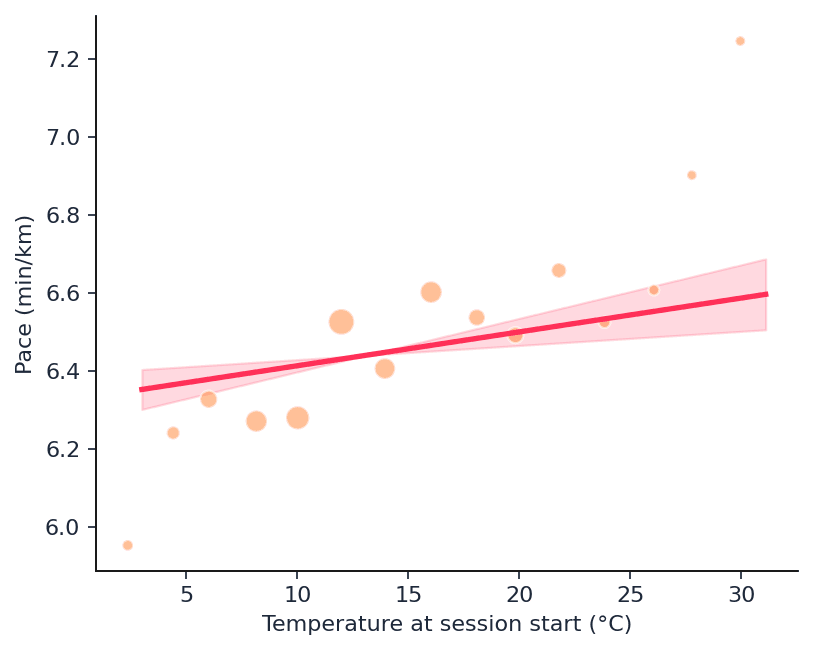
The effect is real but modest. But, temperature explains less than 1% of the variance in pace. A twenty-degree swing might add roughly seventeen seconds per kilometers, a noticeable, but small, relative to day-to-day variation. Non-linear models do not outperform a simple linear fit, although data above 30°C are too sparse to draw firm conclusions. It is London data, after all!
Figures 4-6: Linear Mixed effect Model charts to show how pace, distance, and average heart rate change with start temperature when each runner is allowed their own baseline (random intercept), so the slope is a within-person effect rather than “slow people run on hot days.” Pace creeps up and distance falls as it warms (both significant) while HR stays essentially flat, meaning runners slow down and cut distance rather than hold speed with a higher heart rate.
What does not change: heart rate at effort
When I pooled sessions into narrow pace bands, heart rate in cool and hot conditions is indistinguishable (p > 0.85). Within-person pace-band comparisons show no significant increase in HR with heat. After removing pace and distance effects from heart rate, residuals show no meaningful elevation in warmer bins. Hot sessions do not cluster in a "high HR plus slow pace" corner. Although hard efforts are under-represented on hot days.
Mixed-effects models agree: HR declines by 0.064 bpm per °C, but this is not significant (p = 0.09) and is tiny. With pace and distance controlled, the temperature coefficient on HR is effectively zero (p = 0.75). Runners do not seem to be maintaining speed and paying with a higher heart rate. They ease off, and their hearts reflect the lower intensity. Cardiac cost, defined as heart rate divided by speed, is likewise unchanged across cool and hot conditions.
The real finding: Self-regulation
I think this is a genuinely interesting finding. The analyses describe behavioral change to thermoregulate rather than increase cardiovascular cost. Runners in London's spring climate appear to anticipate thermal discomfort and respond by running shorter, slower runs.
The LLM tells us that we run ~0.009 min/km slower (~0.5 sec/km) for each extra °C, and ~67 m shorter per run for each extra °C at session start. The difference between a 25°C and a 5°C run would amount to 1.3 km shorter and running 10sec/km slower.
Per-runner plots and within-user correlations reinforce this. Most individuals show a slight positive association between temperature and pace, but individual slopes are noisy and rarely significant on their own. The population-level pattern is a gentle average of many small, self-directed adjustments rather than a uniform physiological collapse. It’s the heat that slows you down, not your heart.
References
Cheuvront, S.N., Kenefick, R.W., Montain, S.J. and Sawka, M.N. (2010) ‘Mechanisms of aerobic performance impairment with heat stress and dehydration’, Journal of Applied Physiology, 109(6), pp. 1989–1995. https://doi.org/10.1152/japplphysiol.00367.2010
Corbett, J., White, D.K., Barwood, M.J., Wagstaff, C.R.D., Tipton, M.J., McMorris, T. and Costello, J.T. (2018) ‘The effect of head-to-head competition on behavioural thermoregulation, thermophysiological strain and performance during exercise in the heat’, Sports Medicine, 48, pp. 1269–1279. https://doi.org/10.1007/s40279-017-0816-x
El Helou, N., Tafflet, M., Berthelot, G., Tolaini, J., Marc, A., Guillaume, M., Hausswirth, C. and Toussaint, J.F. (2012) ‘Impact of environmental parameters on marathon running performance’, PLOS ONE, 7(5), e37407. https://doi.org/10.1371/journal.pone.0037407
Ely, M.R., Cheuvront, S.N., Roberts, W.O. and Montain, S.J. (2007) ‘Impact of weather on marathon-running performance’, Medicine & Science in Sports & Exercise, 39(3), pp. 487–493. https://pubmed.ncbi.nlm.nih.gov/17473775/
Ely, M.R., Martin, D.E., Cheuvront, S.N. and Montain, S.J. (2008) ‘Effect of ambient temperature on marathon pacing is dependent on runner ability’, Medicine & Science in Sports & Exercise, 40(9), pp. 1675–1680. https://pubmed.ncbi.nlm.nih.gov/18685522/
Rodrigues Júnior, J.F.C., Mendes, T.T., Gomes, P.F., Silami-Garcia, E., Amorim, F.T., Sevilio Junior, M.N.O., Rossi, F.E. and Wanner, S.P. (2023) ‘Reduced running performance and greater perceived exertion, but similar post-exercise neuromuscular fatigue in tropical natives subjected to a 10 km self-paced run in a hot compared to a temperate environment’, PLOS ONE, 18(8), e0290081. https://doi.org/10.1371/journal.pone.0290081
Tucker, R., Marle, T., Lambert, E.V. and Noakes, T.D. (2006) ‘The rate of heat storage mediates an anticipatory reduction in exercise intensity during cycling at a fixed rating of perceived exertion’, The Journal of Physiology, 574(3), pp. 905–915. https://doi.org/10.1113/jphysiol.2005.101733
Vihma, T. (2010) ‘Effects of weather on the performance of marathon runners’, International Journal of Biometeorology, 54, pp. 297–306. https://doi.org/10.1007/s00484-009-0280-x
Summary questions
Does running in the heat actually raise my heart rate?
No — and that was the surprise finding. Across 3,361 outdoor runs from 878 users, heart rate at matched pace bands was statistically indistinguishable between cool and hot conditions (p > 0.85), and median HR barely moved (154 vs 152 bpm). With pace and distance controlled, the temperature effect on HR was effectively zero (p = 0.75). Your heart isn't working harder in the heat — you're just running easier.
How much slower do I run for each degree warmer it gets?
Mixed-effects models gave each runner their own baseline and found pace rises by about 0.009 min/km per °C (roughly 0.5 sec/km per °C), with p < 0.001. A 20°C swing — say a 5°C versus a 25°C run — works out to about 10 seconds per kilometer slower. Noticeable, but modest compared to normal day-to-day variation.
Do I cut my run short when it's hot, or just slow down?
Both, but distance takes the bigger hit. Median distance fell from 5.59 km in cool conditions to 5.17 km in hot ones, and the mixed-effects model showed runs shrink by 0.067 km per °C (p < 1×10⁻⁶). A 25°C run ends up about 1.3 km shorter than a 5°C run from the same person.
Is it just that slower runners are the ones going out in the heat?
No — that hypothesis was tested directly and rejected. Pooled regression and within-person demeaned models produced nearly identical pace coefficients (~0.006 min/km per °C), meaning the effect holds when you compare each runner against themselves. Among 69 runners with enough cool and hot sessions, 61% were personally slower in the heat.
Why am I not pushing through the heat the way I expected to?
Because runners self-regulate before physiology forces them to. The data describes an anticipatory behavioral response — shorter, slower runs — rather than maintaining pace and paying with cardiovascular strain. Hot sessions don't cluster in a 'high HR plus slow pace' corner, and cardiac cost (HR ÷ speed) is unchanged across temperatures. You're easing off on purpose, even if it doesn't feel like a conscious choice.
How much of my pace variation does temperature actually explain?
Less than 1%. While the temperature effect is statistically robust across 11 different analytical approaches, it's small in practical terms — dwarfed by day-to-day variation in sleep, fueling, route, and motivation. Heat nudges the population average; it doesn't dictate any individual run.
Can wearable data detect heat effects on running performance?
Yes, but you need person-level modeling. Simple pooled comparisons are weak and per-user slopes are noisy, but linear mixed-effects models with a random intercept per runner cleanly isolated within-person effects on pace (p < 0.001) and distance (p < 1×10⁻⁶) across 3,361 sessions. The behavioral signal — shorter and slower in the heat — is visible at population scale without any lab testing.
Should I expect my heart rate to spike on a hot run?
Not if you're running by feel. The data shows runners naturally throttle intensity in warm conditions, so HR stays flat rather than climbing. If you're seeing a clear HR elevation at your usual pace in the heat, you're likely pushing harder than the typical runner does — most people in this London dataset simply slowed down instead.