We use cookies to enhance your browsing experience and analyse our traffic. By clicking “Accept All”, you consent to our use of cookies according to our Cookie Policy. You can change your mind any time by visiting out cookie policy.
We analyzed training data from 425 verified marathon runners to figure out what actually makes people faster. The biggest finding is that consistency beats intensity. Running more days per week matters more than total distance or long runs. Every extra 100km over six months correlates with about 4 minutes off your finish time. And here's the counterintuitive part: more race-pace training is actually associated with slower finishes. Time spent in lower zones (Zone 1) predicts faster marathons. The data suggests you should prioritize showing up regularly, keep most runs comfortable, and let volume do the work.
We analyzed what actually makes marathoners faster — training data from 425 verified runners across major races like NYC, Chicago, London, Boston, and Tokyo.
Consistency beats intensity — running more days per week is a stronger predictor of finish time than total distance or long runs. Runners averaging 5+ sessions per week clustered at faster times.
Key takeaway: more race-pace training correlates with slower finishes. Every extra 1,000 minutes in Zone 1 and Zone 2 predicts ~7 minutes off your marathon time.
Predicting Marathon Performance
Everyone seems to be training for a marathon at the moment, which is great. When I, Alistair, started running, it was the antithesis of cool. Or maybe that was just me! But it’s amazing to see the increased interest in health, fitness, and running.
So we thought we’d try a big data analysis to see if we could determine which types of training helped users complete marathons successfully. Then, build predictive models that demonstrate what a user would need to do to meet their target time. Wouldn’t that be cool! Over the next few research articles, we will try to do just that. Starting with linear analysis.
First, some disclaimers. We are using a large but anonymous dataset. We think we’ve done some pretty clever cleaning and analysis, but we can’t account for everything. We don’t know whether the users are male or female, or whether they record 100% of their training activities. Yes, we focus on linear analysis here, and we have previously stated that human physiology does not generally follow linear relationships. But you have to start somewhere, and more complicated does not always mean better.
Marathon training, in particular, represents a goldmine for such analysis: a 42.2 km test in which months of preparation culminate in a single race-day outcome. We'll dive into a comprehensive analysis of marathon training data from 425 verified runners, drawing on big data principles from seminal studies to build frequentist and Bayesian predictive frameworks. Our aim here is to not only reveal what training elements drive faster finish times but also inform how Terra API can empower users with actionable, uncertainty-aware predictions.
Our dataset is derived from real-world wearable data, filtered to ensure quality and relevance. First, we identified marathon activities as approximately 42km running sessions, yielding 6,165 potential races. We then implemented a 180-day (6-month) pre-race data requirement, narrowing the cohort to 891 users with sufficient history. Extracting exactly 180 days per user produced 199,745 activities.
To verify authenticity, we matched peak dates to major events like the New York City Marathon (226 users), Chicago (124), London (48), Boston (17), and Tokyo (10), using GPS coordinates to locate the activity in those cities. This confirmed 573 marathons, yielding 425 unique verified users and 60,557 activities after excluding outliers at the 95th percentile (total activities capped at 492 to eliminate logging errors, reducing variance by 66%). Mean activities per user: 142.5 (median 68), with a range of 1-3,271 pre-exclusion.
A critical innovation here is controlling for “baseline pace”—the average pace over the first 30 days of the 6-month period—as a proxy for initial fitness. Why? Fast runners inherently train differently and achieve better times, confounding raw correlations. Without adjustment, most of an individual's marathon time reflects underlying fitness, rendering all other variables meaningless. To support this, we found that baseline pace correlates strongly with marathon time (r = 0.588, R² = 0.345), accounting for 34.5% of the variance.
By using partial correlations and residuals (actual minus baseline-predicted time), we isolate true training effects. For instance, zero-order correlations indicate that running distance is associated with faster times; however, after controlling for volume, we assess whether volume independently drives improvement.
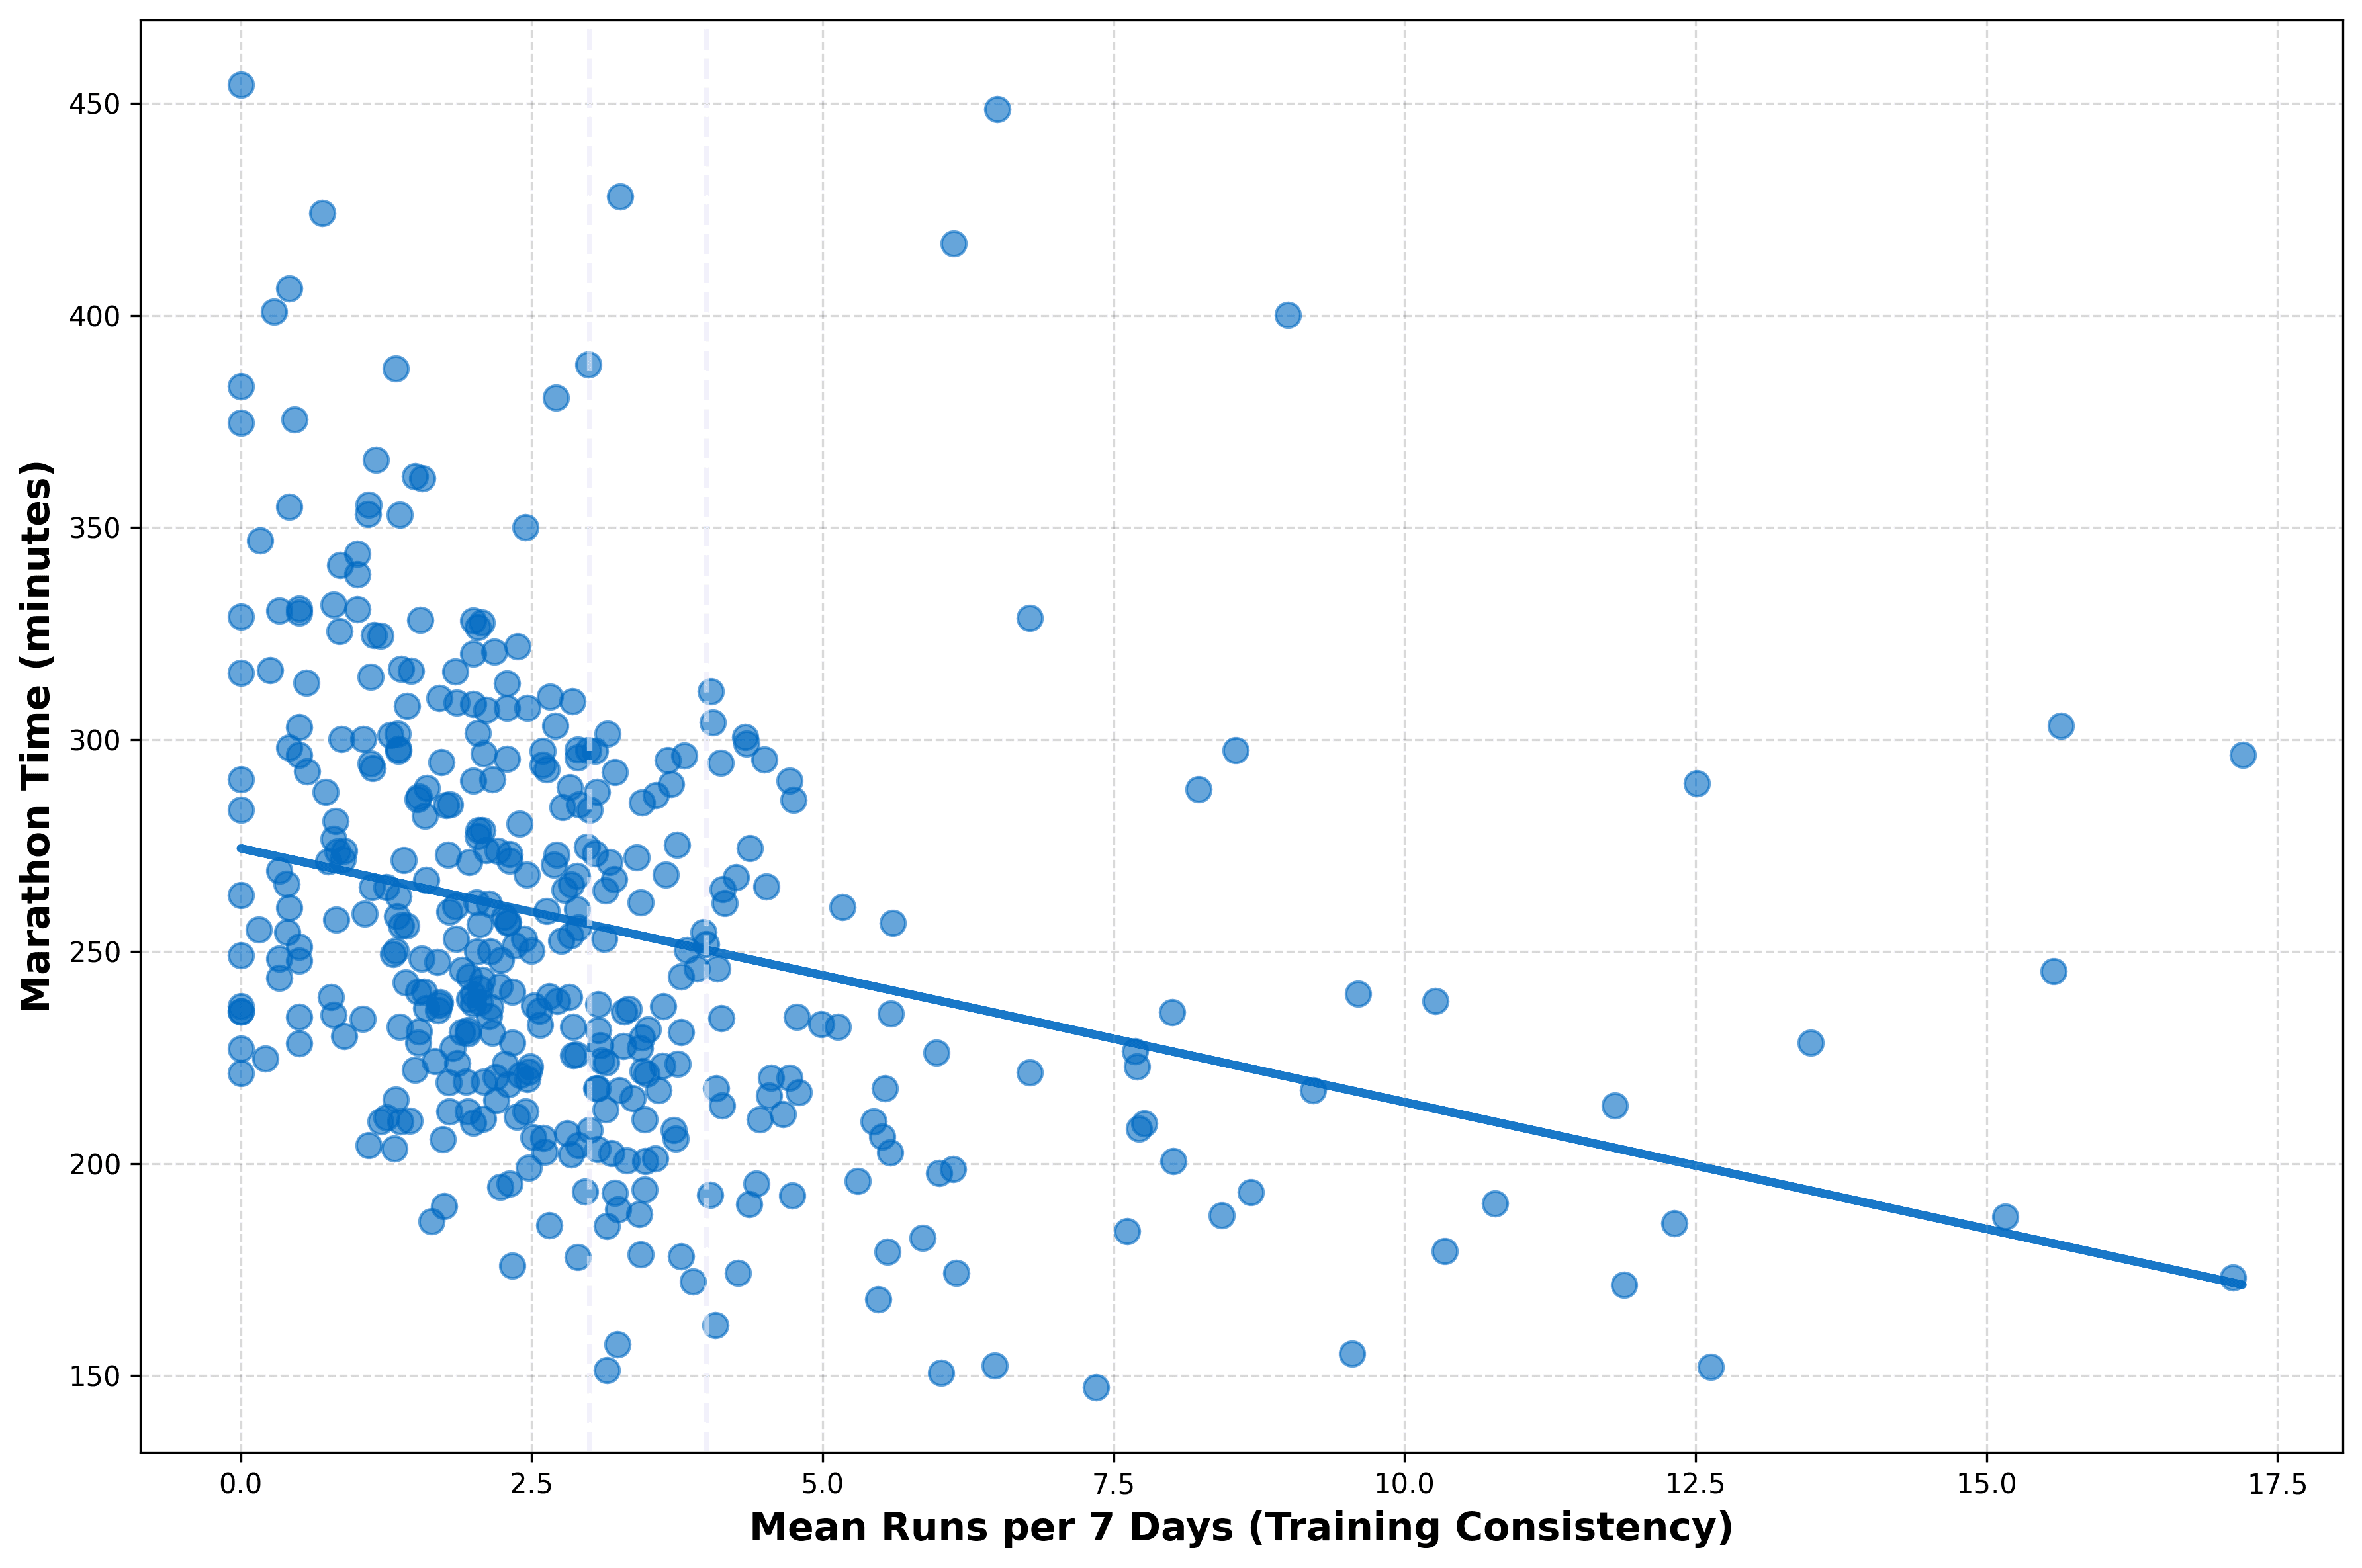
Figure 1: Training Consistency: Mean Runs per 7 Days vs. Marathon TimeScatter plot shows a clear negative relationship: runners averaging 5+ runs/week tend to finish faster (often ≤250 min), while 0–3 runs/week spans much slower times (~350–450 min). Consistency is one of the strongest single predictors (partial r ≈ -0.40 after baseline control), suggesting steady stimulus—not sporadic hard blocks—drives adaptation.
Get the latest Terra Research reports and insights every week as soon as they're published.
Findings spotlight training frequency as the paramount predictor. Running days (unique days with runs) yields r=-0.395 and days active r=-0.361. These are both stronger predictors than volume metrics like total running distance (km) or duration (hours), which show moderate effects.
Modality variables, such as running percentage or strength sessions, are not statistically significant.
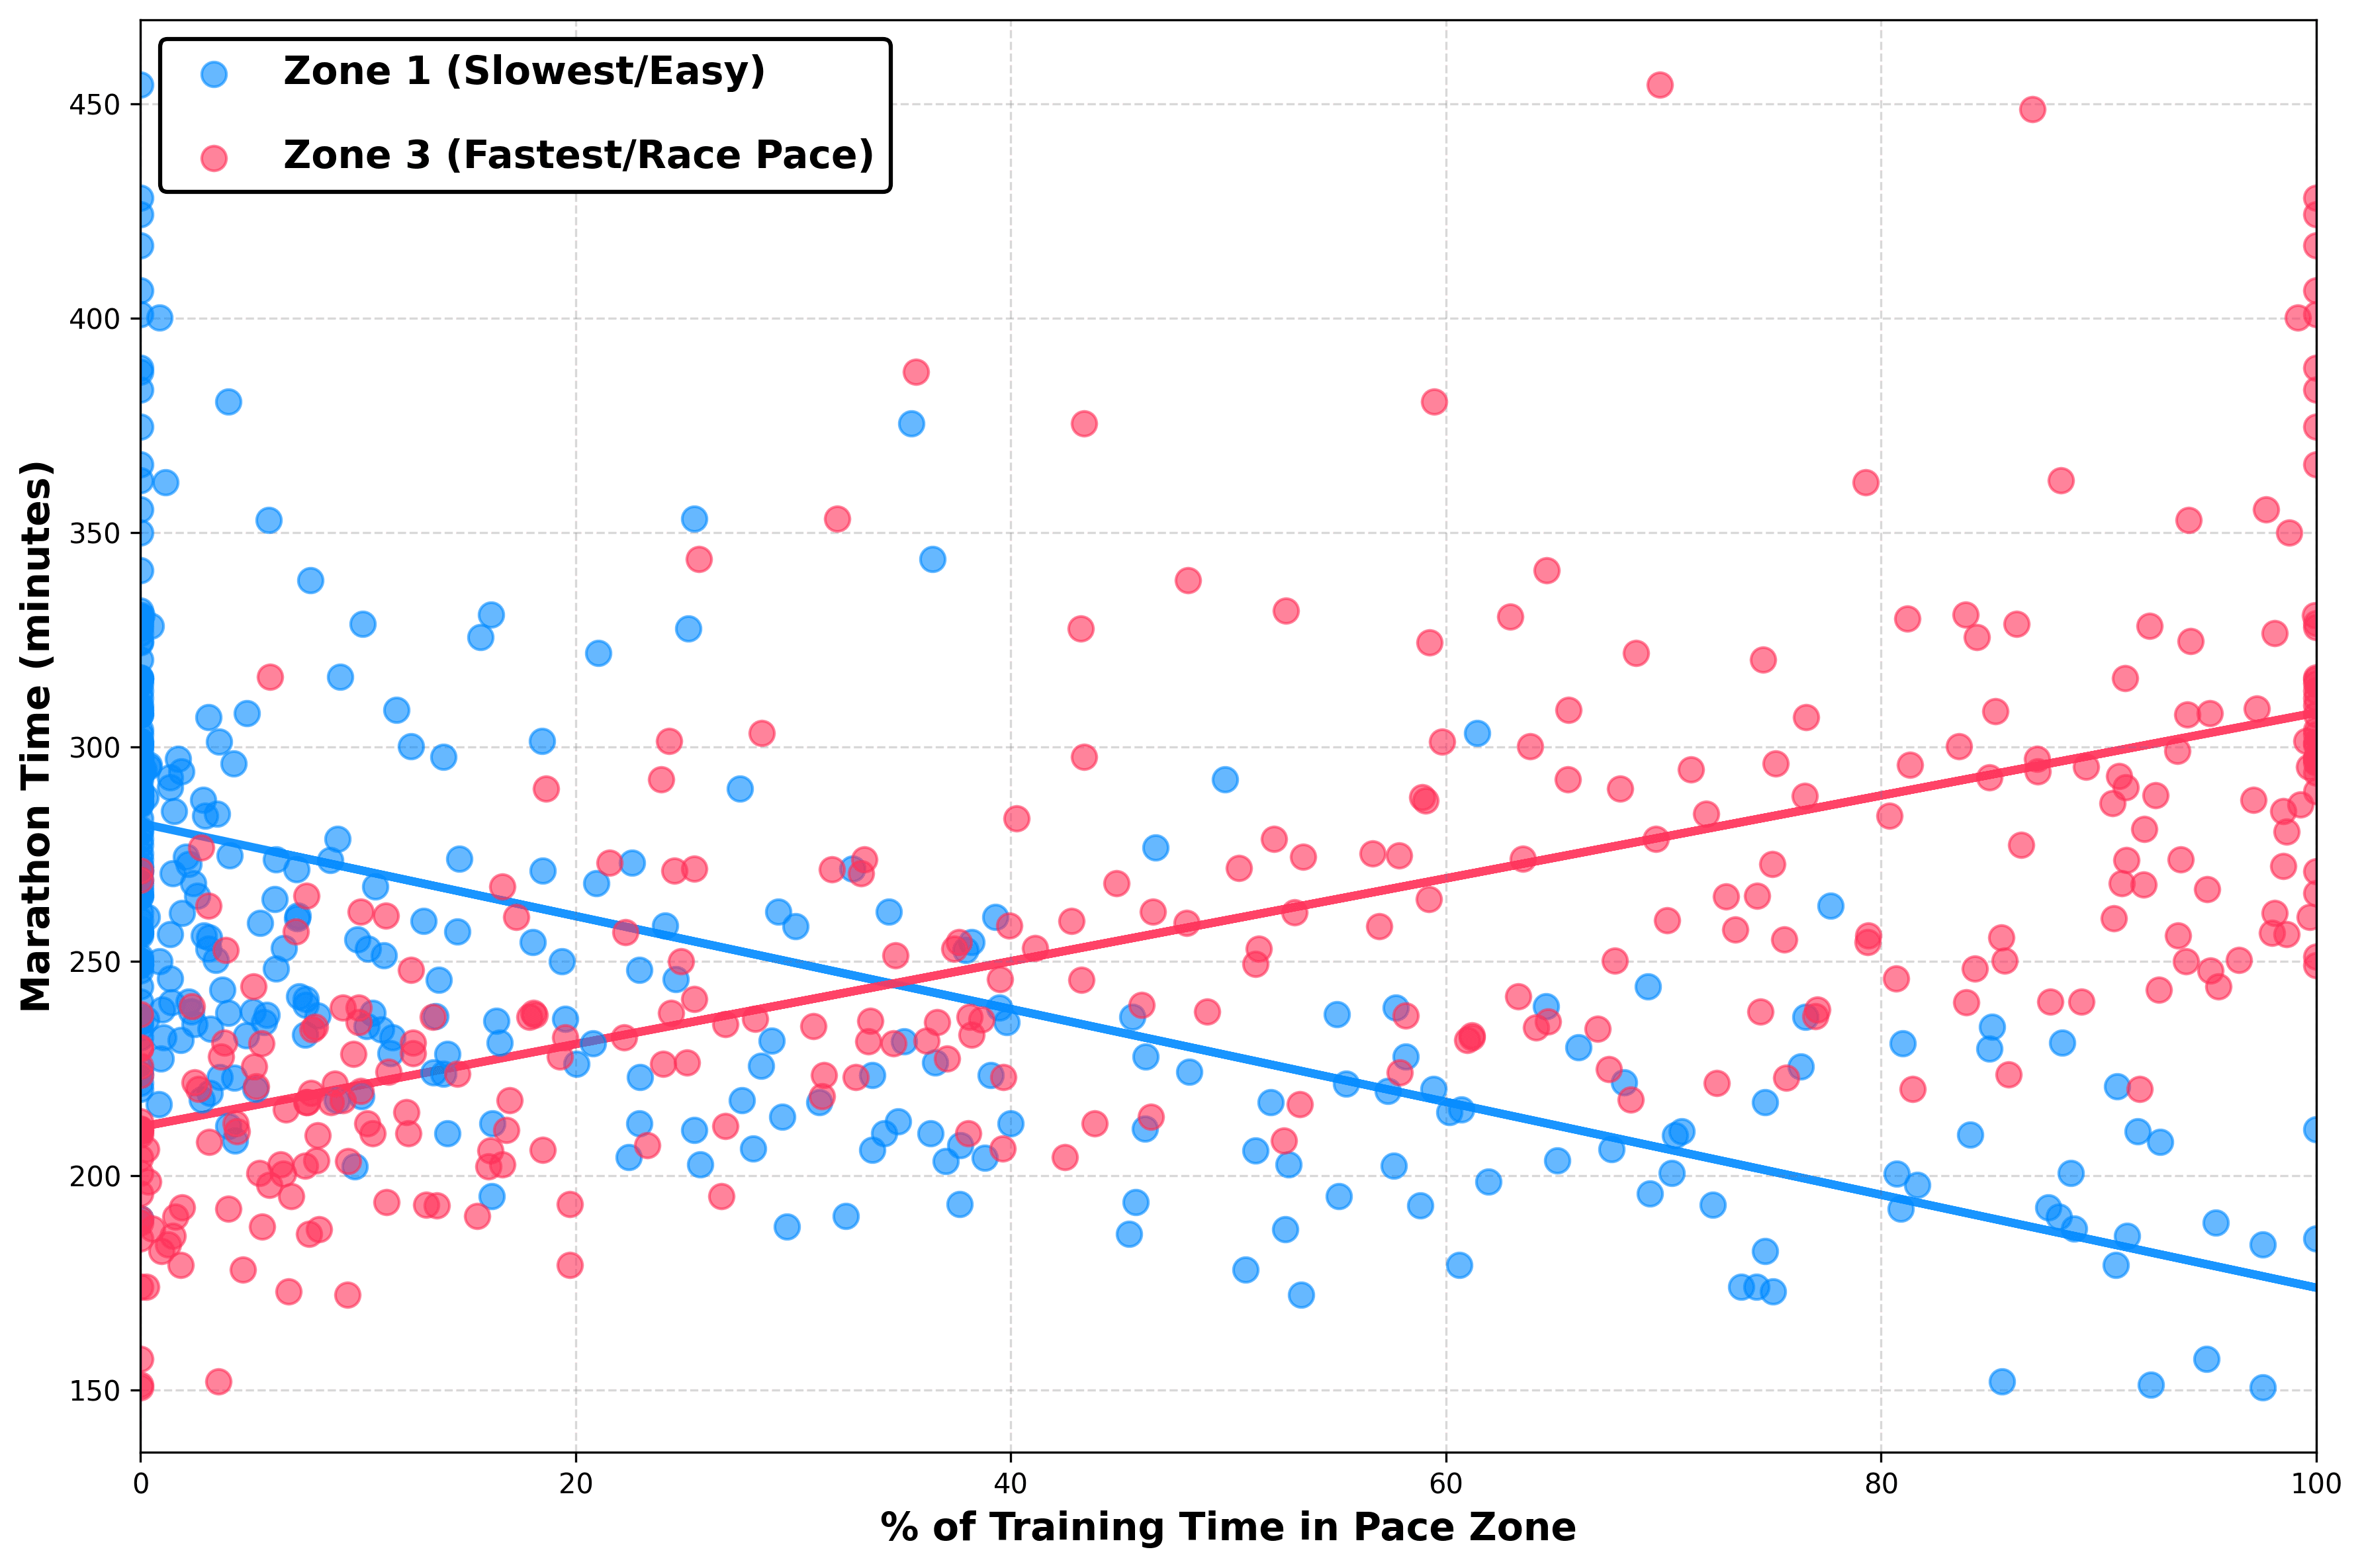
Intensity distribution, binned into zones relative to marathon pace—Zone 1 (slowest, >10% above; easy), Zone 2 (moderate, within 10%), Zone 3 (fastest, at or below; race pace).
Figure 2: Intensity Distribution: % Time in Easy (Zone 1) vs. Race-Pace (Zone 3) Scatter plot of marathon time against percentage of training time spent in Zone 1 (blue, slowest/easy) and Zone 3 (red, fastest/race pace). Blue points trend downward (easier time → faster finishes), while red points trend upward (more race-pace time → slower finishes).
We defined Zones as: 1, any average session pace over 10% slower than marathon pace; Zone 2, between 10% slower and marathon pace; and Zone 3, marathon pace or faster. These don’t align perfectly with the traditional 3-zone model, and they are not supposed to. Another limitation of our study is that we have only overall session data, not second-by-second data.
However, we still think the analysis is predictive and informative. Zone 1 time correlates with faster marathons (r=-0.778), Zone 2 modestly (r=-0.205), but Zone 3 with slower ones (r=0.805). Percentage-based metrics (e.g., pct_time_zone3) remain stable post-volume control (r=0.645-0.655), confirming intensity's volume-independent role.
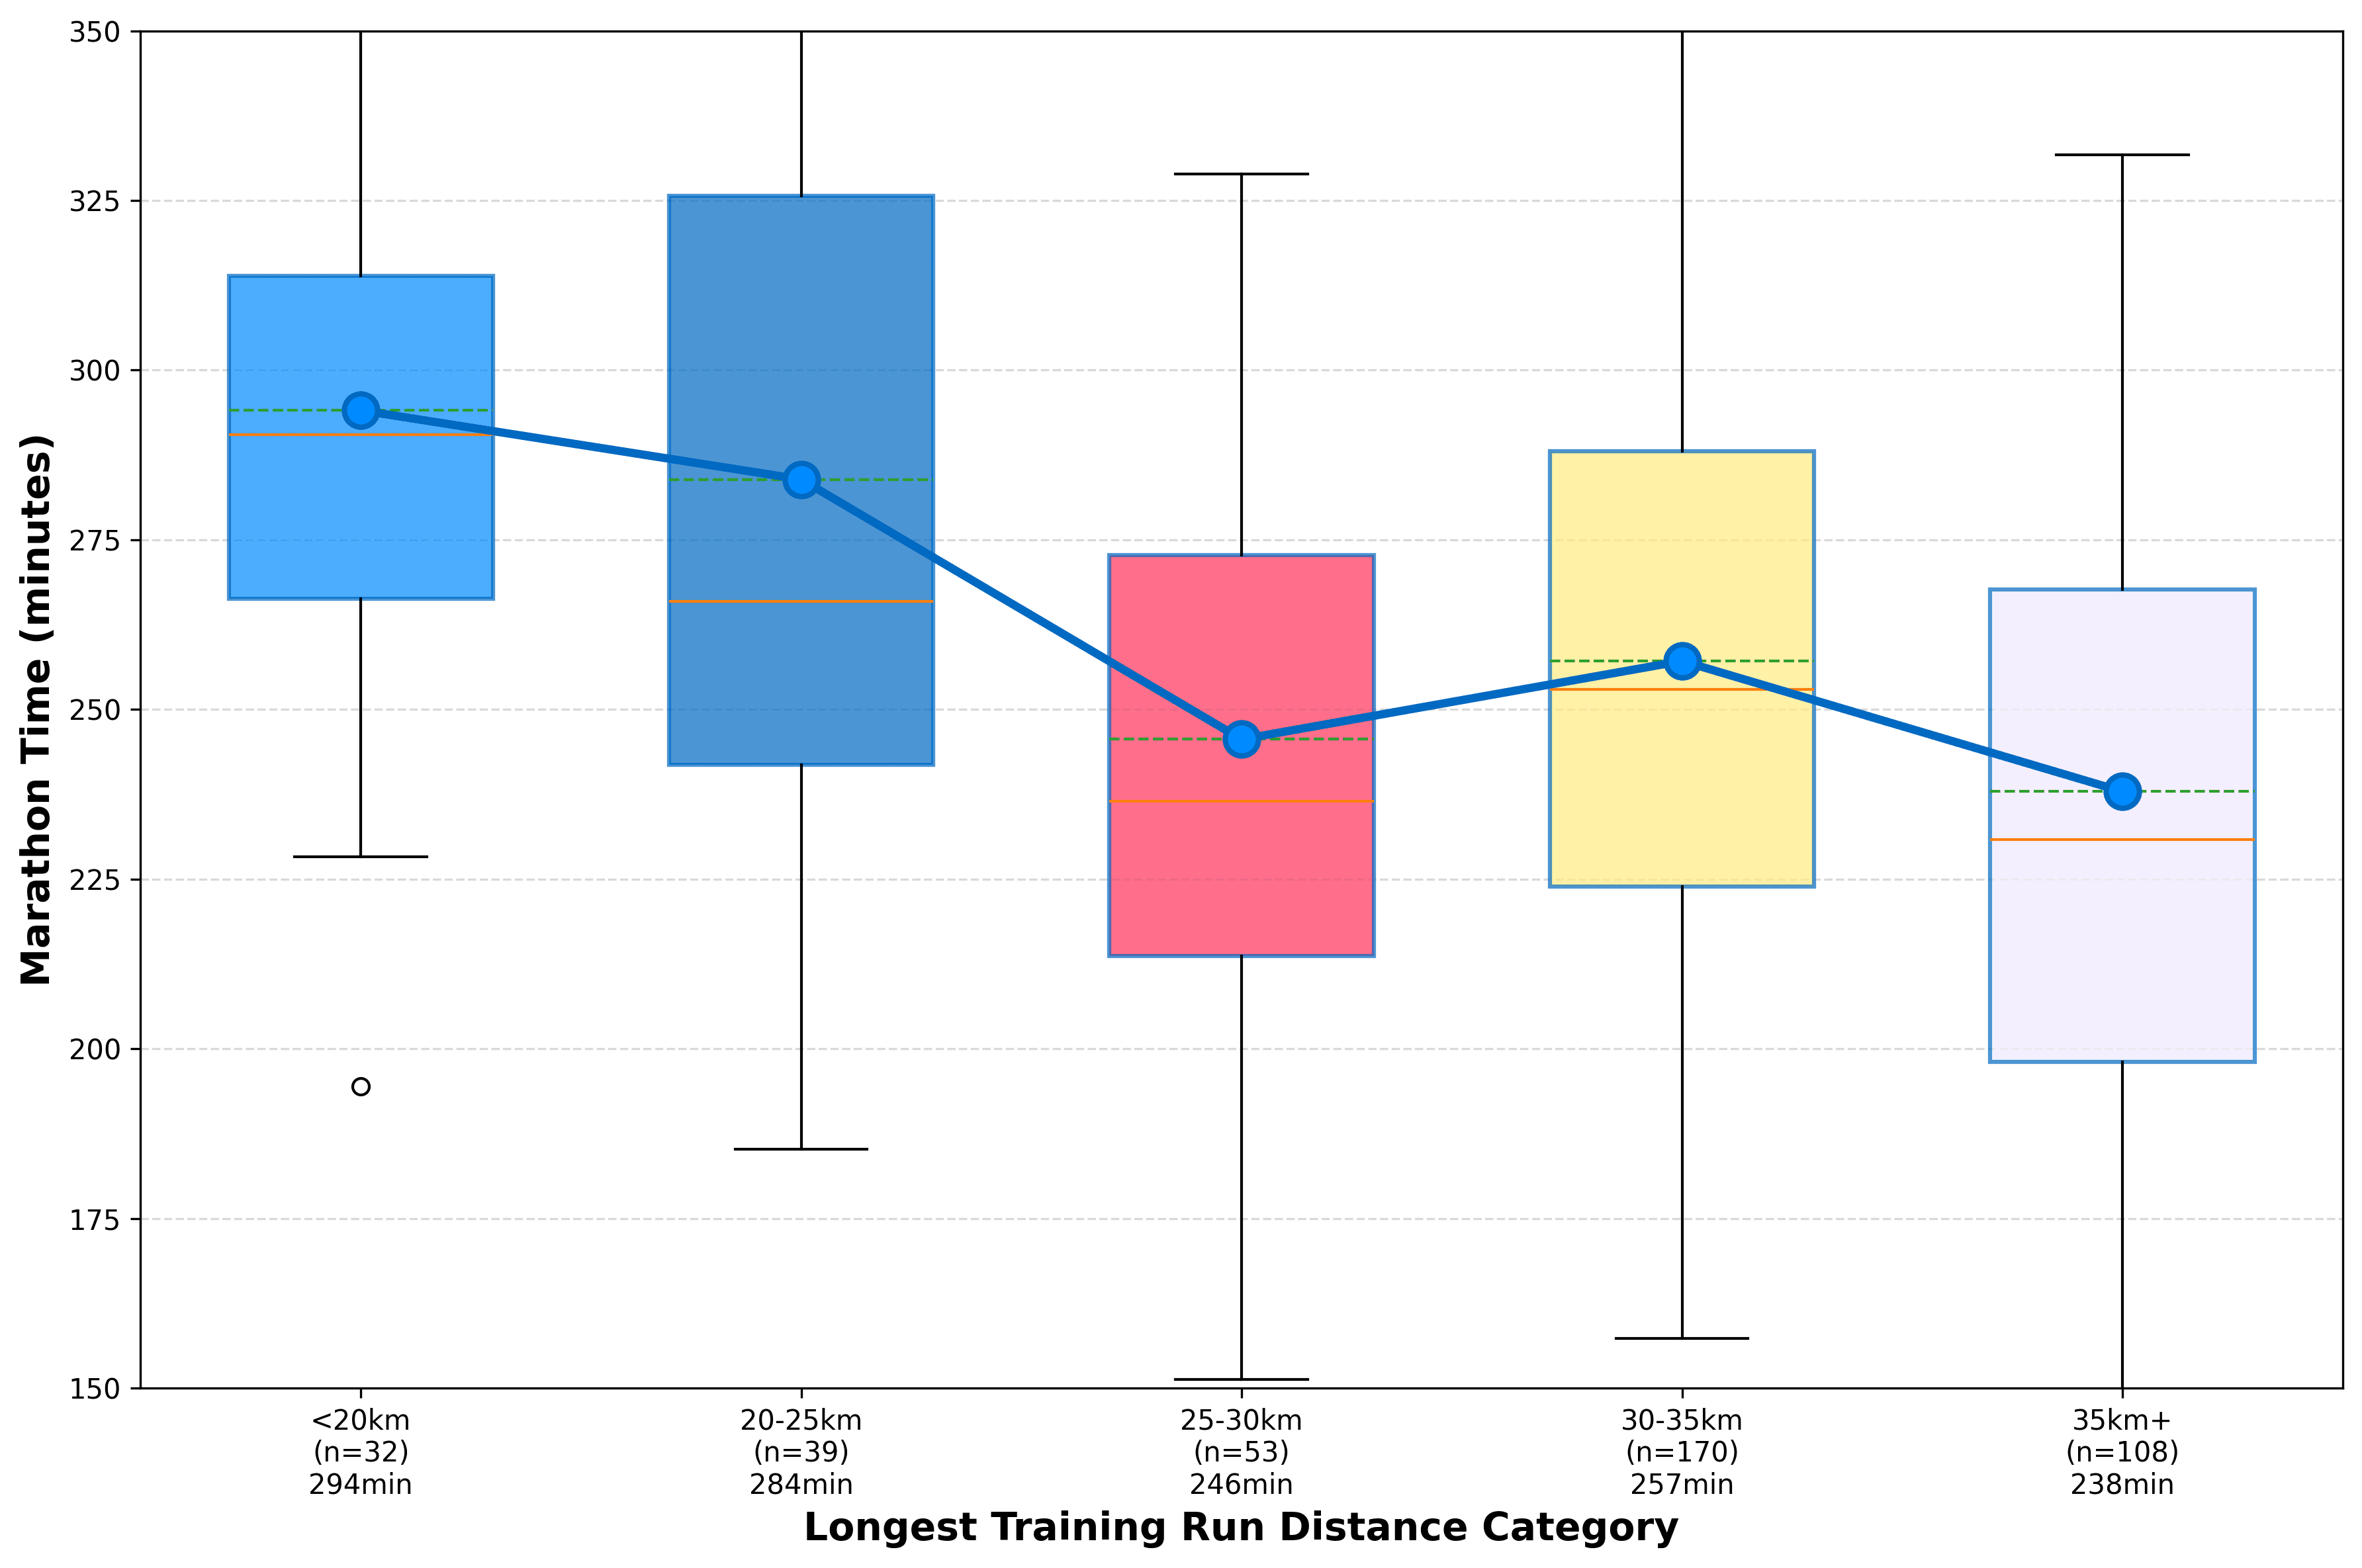
We were particularly interested to see if we could find a “Long run” effect. The long run is often mythologized in training lore, but proves to be a weaker predictor.
Mean longest run: 32.05 km (75% of marathon distance), timed on average about 33 days pre-race. Univariate correlations show longer runs (r = -0.146) and pace (r = 0.320) are associated with better times, but in post-baseline analyses, distance is not significant (r = 0.127, p = 0.180).
Figure 3: Longest Training Run Distance vs. Marathon Time Marathon times improve as the longest run increases, with the best averages typically in the 25–35 km range, and mean times dropping from 294 min (<20 km) to 238 min (35+ km). However, once you control for baseline pace and total volume, longest-run distance (and long-run frequency, r = -0.249 univariately) adds little independent signal, suggesting the apparent benefit is largely explained by overall training volume and consistency.
Can We Model Marathon Training?
We built a multivariate linear regression to predict marathon time, always including baseline pace (baseline R² = 0.290). The initial full model achieves an R² of 0.823, explaining 82% of the variance; 53% of this is attributable to training alone.
Standardized coefficients:
Running distance -40.17 (p=0.038; more km → faster)
Zone 3 time +37.89 (p=0.002; more race pace → slower)
Baseline pace +26.47 (p<0.001)
Zone 1 time +22.81 (p=0.041; easy → faster)
Zone 2 +21.09 (p=0.020).
Equation:
Time (min) = 91.84 + 26.47 × Baseline Pace - 0.044 × Running Distance + 0.009 × Zone 3 Time + 0.007 × Zone 1 Time + 0.013 × Zone 2 Time.
Practically, 100 km extra means you’ll run about 4 min 24 seconds faster; 1,000 min more easy: 7 min gain; but 100 min more race pace: 54 seconds slower. Long-run variables didn't enter the model; their impact was subsumed by the total distance coefficient (-40.17).
To go beyond basic averages and to try give more realistic predictions, we built a Bayesian linear regression model. This approach is great for wearable data because it starts with what we already know (or reasonably expect) from running science, then updates those beliefs. The result is a prediction that comes with a full range of uncertainty
We used data from 114 runners who had complete, clean records (baseline pace, total running distance, time in each zone, etc.). The model predicts marathon finish time in minutes.
The equation:
Marathon Time (minutes) ≈ Constant + 36.55 × Baseline Pace + 0.69 × % Time in Zone 3 (race pace or faster) + smaller contributions from other variables
Baseline Pace is your average pace (min/km) during the first 30 days of training. Coefficient = 36.55: for every 1 min/km faster your baseline pace is, the model predicts you will finish approximately 36.5 minutes faster. 95% credible interval: [34.0, 39.1] minutes (very confident this effect is strong and positive). This is an interesting finding. If everyone improves at the same rate, we would expect this to be 42 minutes. However, runners who start more slowly have more “room” for improvement, and the model identifies this.
% Time in Zone 3 is the percentage of your total training time spent at or faster than marathon race pace. Coefficient = 0.69 → for every extra 1% of training time spent in Zone 3, the model predicts you finish about 0.69 minutes (roughly 41 seconds) slower. 95% credible interval: [0.51, 0.88] minutes (100% probability the effect is negative—more race-pace training hurts performance in this sample).
Other variables (like total running distance km, time in Zone 1 easy minutes, etc.) were included but had credible intervals that crossed zero, so we can’t be confident they add meaningful independent information once baseline pace and % Zone 3 are accounted for.
Typical prediction error: The model’s residual standard deviation is about 22.3 minutes. That means most predictions fall within roughly ±45 minutes of the actual time, at first glance, not massively useful!
This uncertainty-aware output is something we want to do more work on at Terra (e.g “There’s an 80% chance you’ll go sub-4:00 if you keep this easy-volume trend”) because it fully informs the consumer as part of an evidence-based approach
Key Takeaways
At its core, this analysis of 403 verified marathon finishers, drawn from real wearable data aggregated over six months, shows that marathon success is less about the big race-pace sessions or perfectly structured long runs and far more about patient, consistent building blocks. Consistency is a recurring theme in all of our blogs; this subject is no different.
After controlling for baseline pace (your starting fitness in the first 30 training days, which alone explains ~35% of finish-time variance), the strongest signals are clear: prioritize frequency and consistency (aim for 150+ active days and multiple (consistent) runs per week), flood your training with easy Zone 1 miles (slowest pace, low effort), and accumulate balanced volume in the 500–1,000 km range over the build-up period.
Excessive time at or faster than race pace (Zone 3) reliably predicts slower finishes, even when volume is held constant, reinforcing the classic polarized training principle: the vast majority of your training should feel easy and sustainable.
This pattern also matches what I’ve experienced over 25+ years of endurance training: those high-intensity sessions feel electric, as if they’re moving the needle quickly. They deliver a rush and some real physiological gains, but in practice, their impact is modest and short-lived unless they sit on top of a rock-solid foundation of consistent low-intensity volume.
Without that aerobic base, hard work quickly becomes diminishing returns, or worse, fatigue and stagnation. The data confirms what experience taught me: easy miles are the quiet engine; hard efforts are the turbo boost that only shines when the engine is already humming.
The multivariate model (R² = 0.823) and Bayesian extension both confirm this pattern: more total distance and easy time shave minutes off your marathon, while every extra percentage point in race-pace work adds roughly 54 seconds of penalty.
The big caveat? These are average trends across a diverse group of recreational and semi-serious runners; individual responses vary due to genetics, recovery capacity, life stress, and unmeasured factors such as sleep and nutrition. More of this and non-linear modeling in the next blogs.
Whether you’re chasing a sub-3:00 or just hoping to finish, the message is democratizing: your peak performance is built week by week through consistent, mostly easy effort, guided by your own data. So lace up, log every mile, and have faith you’re getting fitter. Your next personal best is only many easy kilometers away.
Summary questions
What actually predicts a faster marathon time — volume, intensity, or consistency?
Consistency wins. Across 425 verified marathoners and 60,557 activities, training frequency was the strongest single predictor: running days correlated with finish time at r=-0.395 and active days at r=-0.361, both beating total distance and duration. Runners averaging 5+ runs per week clustered under 250 minutes, while those at 0–3 runs/week stretched out to 350–450 minutes.
Does running at race pace make me faster on race day?
No — it consistently predicts slower finishes. Time spent in Zone 3 (at or faster than marathon pace) correlated with slower marathons at r=0.805, and the Bayesian model showed a 100% probability that more Zone 3 time hurts performance, with every extra 1% of race-pace training adding about 41 seconds to finish time. Even after controlling for volume, the penalty held (r=0.645–0.655).
How much of my marathon time is just my starting fitness?
About a third. Baseline pace — your average pace over the first 30 days of the 6-month build — correlated with marathon time at r=0.588 and explained 34.5% of the variance on its own. That's why the analysis controls for it: without that adjustment, training variables look meaningless because they're swamped by underlying fitness.
Does the long run really matter as much as training lore suggests?
Less than you'd think. The mean longest run was 32.05 km, done about 33 days pre-race, and univariately it correlated with faster times (r=-0.146 for distance, r=-0.249 for frequency). But once baseline pace and total volume were controlled, longest-run distance lost significance (r=0.127, p=0.180) — its apparent benefit was really just a proxy for overall volume and consistency.
How much faster will I run if I add more easy miles?
Roughly 4 minutes 24 seconds per extra 100 km of total running, and about 7 minutes for every extra 1,000 minutes of Zone 1 easy time, according to the multivariate model (R²=0.823). Meanwhile, every extra 100 minutes at race pace adds about 54 seconds to your finish. The math strongly favors patient, easy volume over hard sessions.
Can wearable data actually predict marathon finish times?
Yes, and with quantified uncertainty. The multivariate linear model explained 82.3% of finish-time variance, with 53% attributable to training factors alone. The Bayesian extension on 114 clean records produced a residual standard deviation of about 22.3 minutes — meaning predictions fall within roughly ±45 minutes — but importantly returns a full probability distribution rather than a single point estimate.
Why do slower runners seem to improve more from the same training?
They have more headroom. The Bayesian coefficient on baseline pace was 36.55 minutes per 1 min/km — notably less than the 42 minutes you'd expect if everyone improved proportionally. That gap means runners starting from a slower baseline tend to gain more from the same training stimulus, which is encouraging news for newer or mid-pack marathoners.
What's the ideal training recipe this data points to?
Aim for 150+ active days in the build-up, multiple consistent runs per week, and 500–1,000 km of total volume — with the vast majority of that time in Zone 1 easy effort. Keep race-pace work minimal, since every percentage point increase in Zone 3 reliably costs you time. It's the classic polarized model: easy miles are the engine, hard efforts only pay off on top of that foundation.