We use cookies to enhance your browsing experience and analyse our traffic. By clicking “Accept All”, you consent to our use of cookies according to our Cookie Policy. You can change your mind any time by visiting out cookie policy.
Think a good HRV score follows a good night’s sleep? Think again!
Despite their perceived link, sleep and HRV are only weakly correlated. The analysis of nearly 90,000 nights showed that sleep duration accounted for less than 1% of the variation in next-day HRV, highlighting that other factors like stress or alcohol have a far greater impact.
Sleep and HRV are only loosely connected. Despite analysing nearly 90,000 nights, sleep duration explained less than 1% of next-day HRV variation. Any direct link is very weak and easily drowned out by other factors.
Consistency matters more than hours. People with irregular sleep patterns showed slightly stronger sleep-HRV coupling, suggesting that variability, not duration, may be the bigger disruptor. Stable routines trump single long nights.
HRV reflects the whole system, not just sleep. Stress, stimulants, temperature, meals, and travel often overshadow the subtle influence of sleep. HRV remains a useful marker of overall recovery, but not a simple mirror of last night’s slumber.
Think a good HRV score follows a good night’s sleep? Think again!
Sleep and heart‑rate variability (HRV) are the twin celebrities of our wearable data. They are the key variables most of us turn to every morning for insights into stress, recovery, and the day's potential. So, I wondered if I could find a good relationship between the two metrics from one day to the next? To find out, I analysed 89,628 nights of consumer‑grade recordings from 1,199 adults. Spoiler: Like so often in science, the verdict was a bit disappointing; it was neither scandalous nor headline‑grabbing.
Get the latest Terra Research reports and insights every week as soon as they're published.
Quick recap. HRV measures the microsecond dance between successive heartbeats produced by the tug‑of‑war between sympathetic and parasympathetic nerves. High HRV at rest typically indicates a resilient cardiovascular system that can adapt on demand; low HRV suggests fatigue, illness, or overtraining. Sleep, meanwhile, is a time when the parasympathetic tone predominates, and the body repairs itself. It makes sense that restricting sleep for a night or two would suppress next‑day HRV, while a deep restorative kip should nudge it upward. Those findings fuel the widespread expectation that the two metrics should move hand‑in‑hand.
In the first blog we looked at the population patterns of HRV and Sleep, and in the second we focused in on delta HRV. Now we are looking for a true relationship, between two physiological variables where it should exist!
Method
Among a normal population, HRV varies widely between individuals, while total sleep time remains within a much narrower band. Comparing raw numbers across people tells us very little. Instead, again we examined change using ΔHRV = HRV(t + 1) – HRV(t) and converted both ΔHRV and nightly sleep durations into 28‑day rolling Z‑scores. Rolling normalisation anchors each participant on a personal baseline, highlights unusual deviations and, crucially, keeps the analysis meaningful even when the underlying data are not perfectly bell‑shaped. For sleep, I also computed 3-, 5-, and 7-day linear slopes to capture emerging trends rather than single-night noise.
Here I used the same dataset that we described in the previous two blogs.
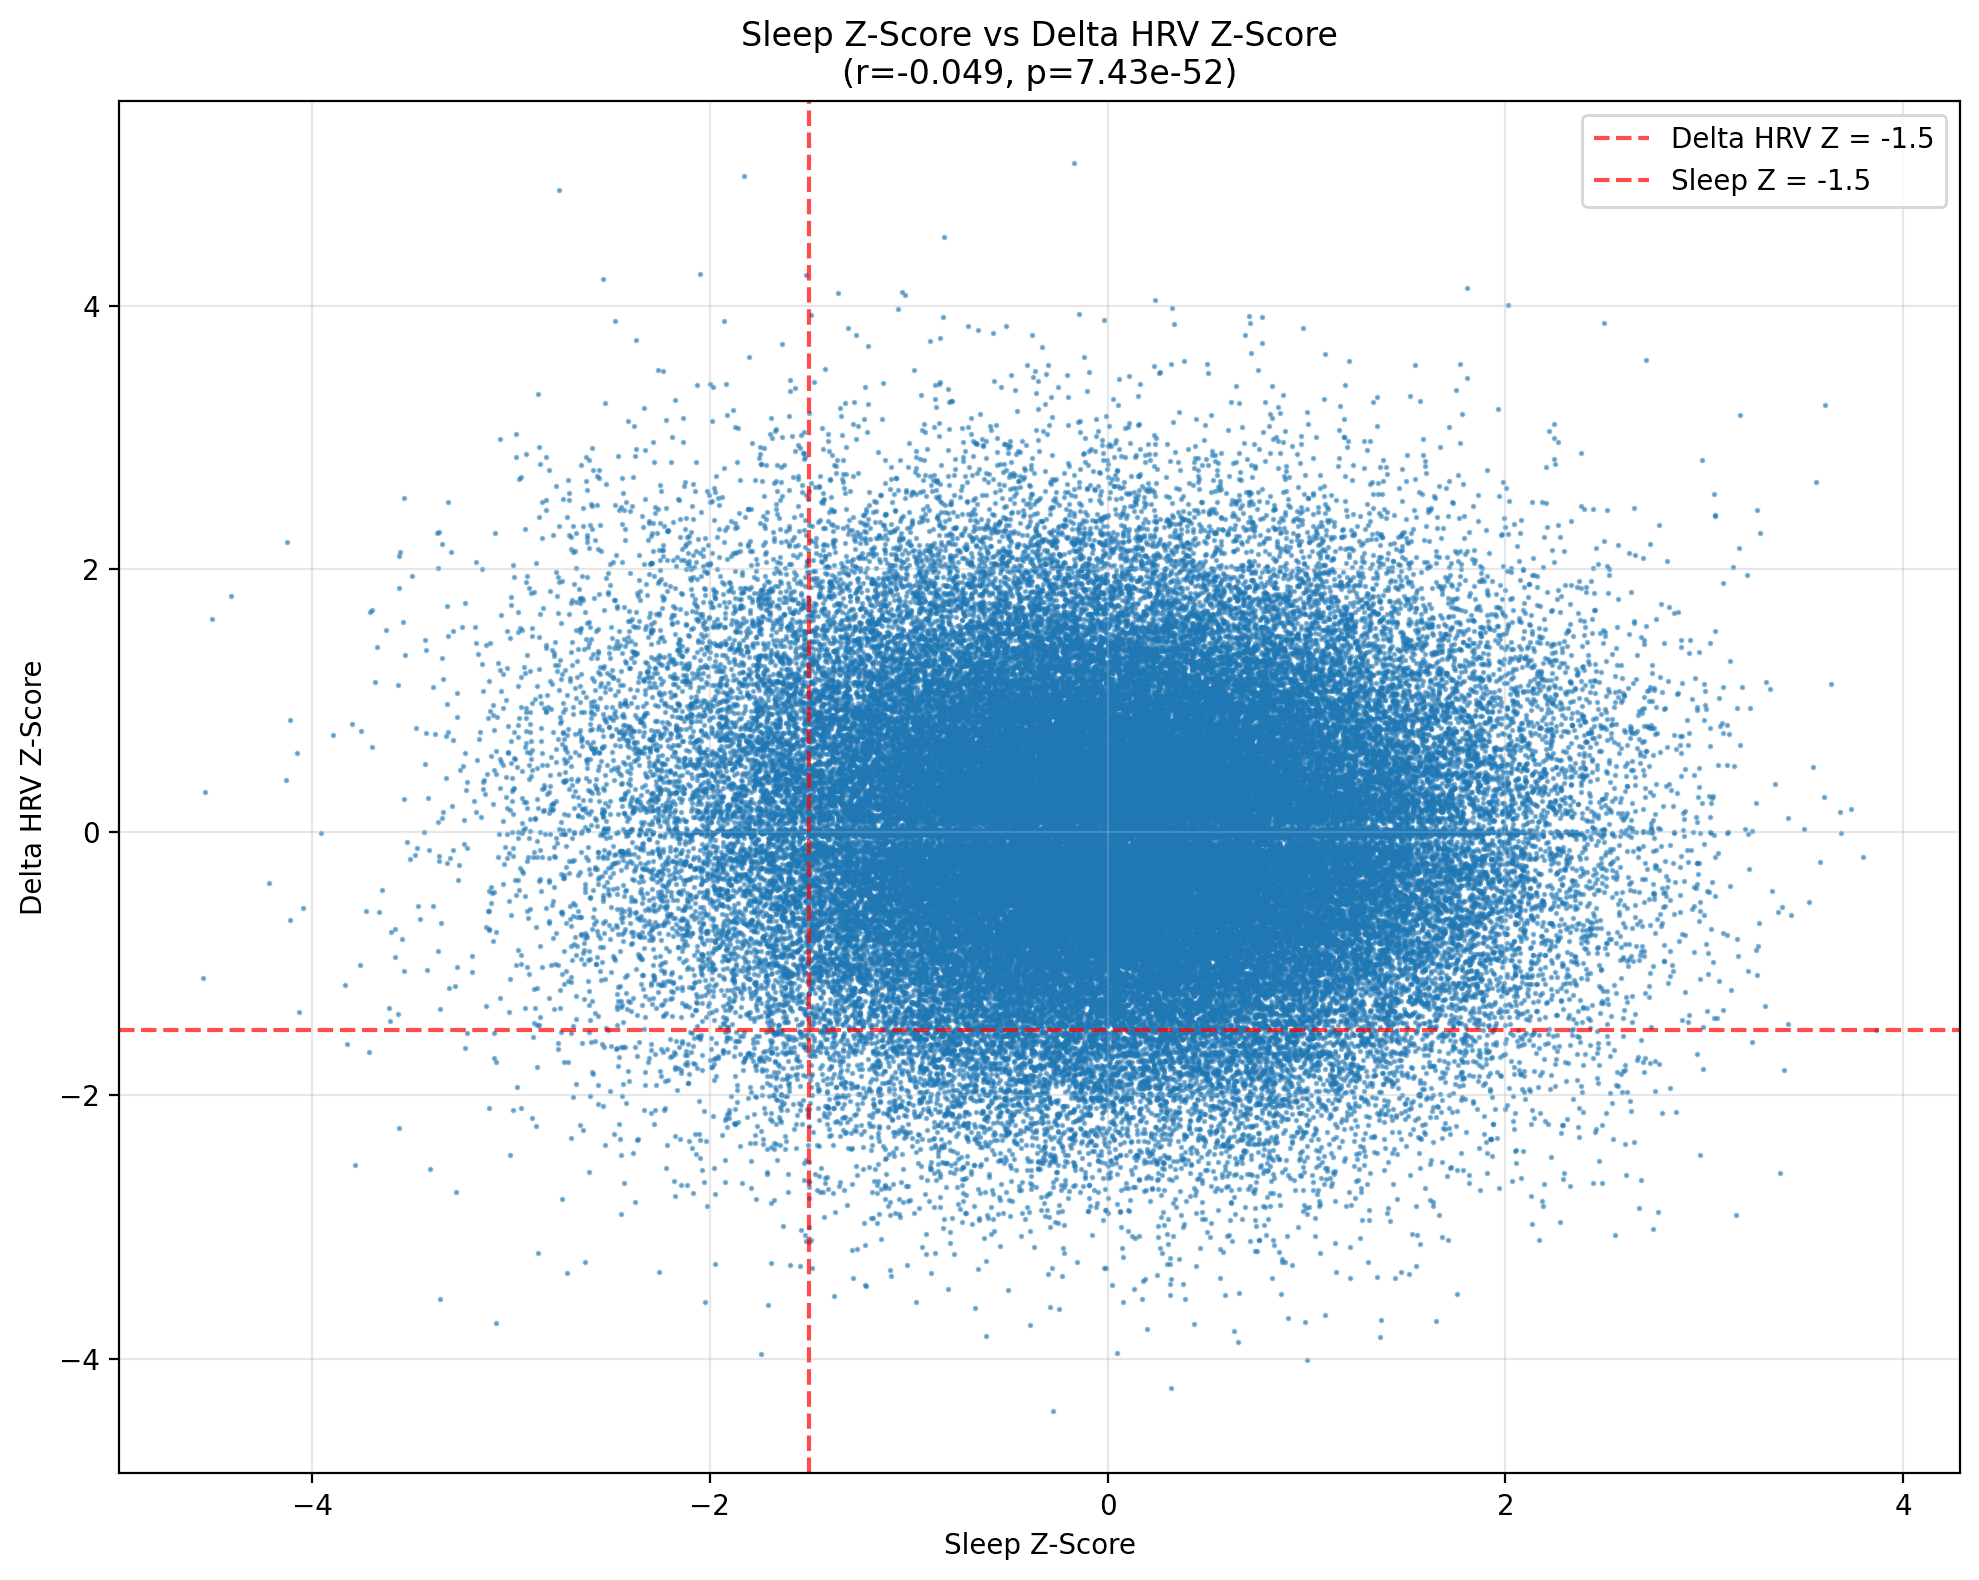
Figure 1: A big blob of a scatter plot.
As you can see, plotting every Z‑scored pair produces a dense blue cloud that doesn’t look like a relationship to me. The Pearson coefficient is r = –0.0496 (p ≈ 7 × 10⁻⁵⁰). Statistically significant, yes—the curse of large samples—but its practical heft (or effect size) is microscopic. A one‑standard‑deviation jump in sleep corresponds to a mere five‑hundredths of a standard‑deviation dip in ΔHRV, a shift well within the margin of measurement noise for optical sensors.
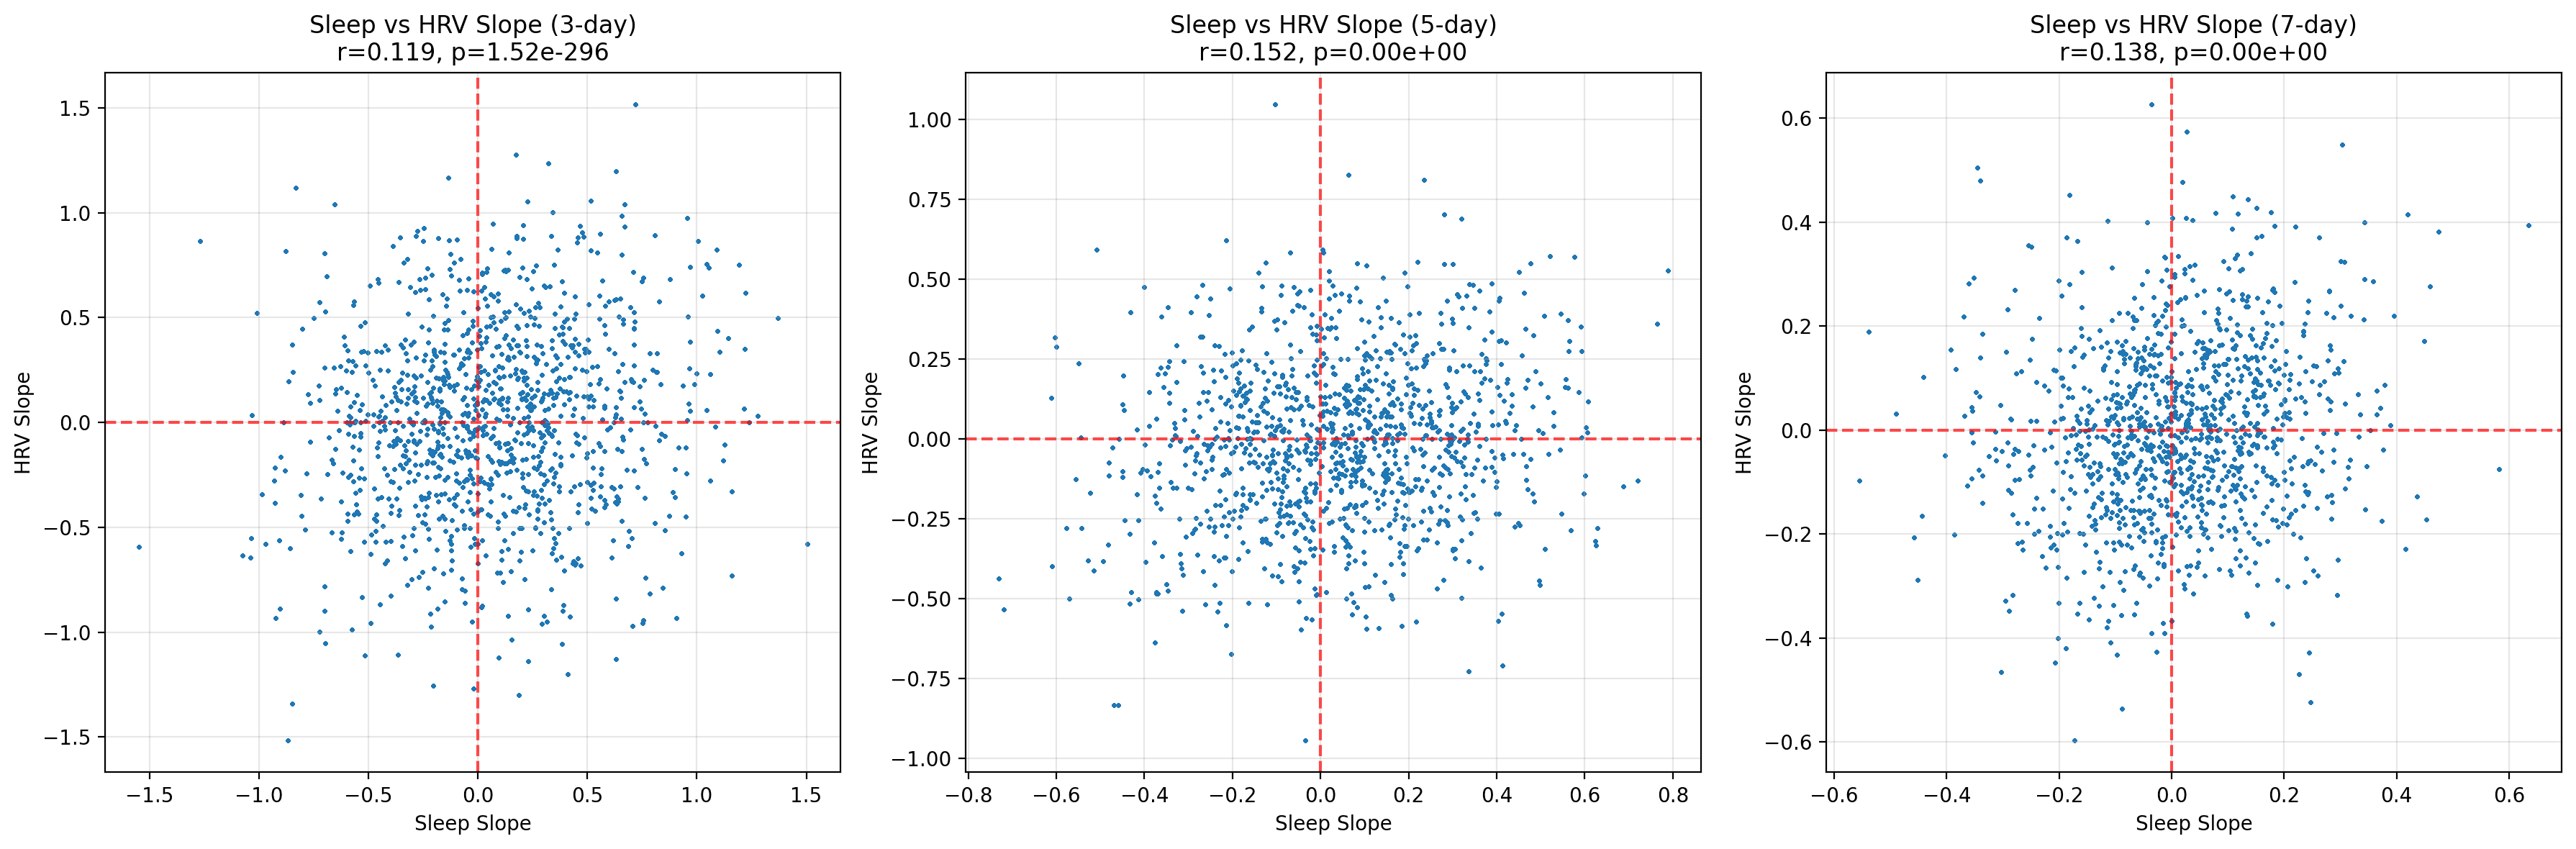
Figure 2: Do trends fare any better?
The Role of Trends and Permutation Testing
Rolling slopes speak to direction rather than magnitude: are we sleeping progressively longer or shorter, is HRV trending up or down? Even here, the relationship remains shy. Correlations inch upwards (r ≈ 0.12 for three‑day windows, peaking around 0.15 for five‑day slopes) but are all weak. In practical terms, a week of improving sleep predicts at most a sliver of improvement in HRV trajectory.
Because physiology rarely works instantaneously, I staggered sleep one, three and five days behind HRV. The coefficients wandered from –0.015 to +0.001, essentially zero. Conditional probabilities paint the same restrained picture. Label nights with sleep Z < –1.5 as “particularly poor”, and HRV plunges (ΔHRV Z < –1.5) follow only 6.3 % of the time. Flip the question—did a major HRV crash have awful sleep the night before?—and the proportion is 6.5 %. Whether I look at one, three or five nights apart, the numbers hover around six to seven per cent. Co‑occurrence of both extremes on the same date is downright rare at half a per‑cent.
Adding slopes to the mix introduces a subtle variation. After an especially bad‑sleep night, the probability that HRV’s seven‑day slope is negative nudges 52 %, barely above chance but marginally higher than shorter windows. The pattern suggests that a sustained sleep drought might slightly tilt the autonomic trendline downward.
To separate signal from coincidence, I employed permutation testing on the dataset. Large datasets invite spurious associations, so I challenged our correlations with a rigorous within‑user permutation test. For every participant, sleep sequences were shuffled 1,000 times, and the sleep→ΔHRV correlation was recalculated each round to build a null distribution. The result was then benchmarked against the original statistic. A Benjamini–Hochberg false‑discovery‑rate correction across all 1,199 individuals trimmed the field dramatically: just 33 users (2.8 %) held on to significance at FDR < 0.05. In other words, more than nine‑tenths of seemingly interesting links dissolved once chance was ruled out. Even among these 33 “responders”, effect sizes remained modest, and their sole distinguishing trait was greater night‑to‑night sleep variability (1.21 h vs 1.00 h). Mean sleep duration and mean HRV were virtually identical to the cohort at large. Permutation testing reinforces our central message: meaningful sleep-to-HRV coupling is the exception, not the rule, and appears to be most prevalent in individuals with erratic sleep patterns.
Possible Explanations
So what’s going on? Firstly, I think several biological and technical factors are conspiring to obscure the link. HRV is exquisitely sensitive to stimulants, emotional stress, ambient temperature, meal timing and many more things. Any one of those factors can swamp the gentle recovery boost conferred by a good night’s rest. Paradoxically, maybe the body also deploys a homeostatic rebound: after bad sleep, the parasympathetic arm may counter‑attack, nudging HRV upward rather than downward, while a luxurious lie‑in leaves less headroom for further recovery, sometimes resulting in a trivial HRV dip. And, of course, sensor imprecision has to be mentioned in the list of excuses for finding nothing of note.
Practical Takeaways
Practical advice for individual users:
Don’t expect last night’s hours in bed to predict today’s HRV plot. The effect exists, but it is vanishingly small.
Chase consistency, not duration. Irregular bedtimes increase both sleep and HRV volatility and may amplify the small negative link we observed.
Track personal baselines. I still think Z‑scores are your friends: they reveal when you deviate meaningfully from your norm rather than from an abstract population average.
Context is king. HRV plunges after a stressful presentation or a long‑haul flight tells you more than a five‑minute gain in last night’s slumber.
For group‑level monitoring—think squad recovery dashboards or cohort research—sleep duration alone explains well under one per cent of variation in next‑day ΔHRV. We are confident that we would get better insights by layering in sleep quality metrics (such as latency, REM proportion, etc.), training load, subjective mood, or even skin temperature. More on this in future blogs.
Limitations and Future Directions
A quick note on the limitations. Our analysis relied on consumer devices that estimate HRV from nocturnal photoplethysmography. We ignored nap data, assumed that the delta between consecutive nights captures the physiologically relevant window, and stopped at five‑day lags. People also differed in age, fitness, and chronotype—variables we did not adjust for, but that could modulate the sleep-HRV link. Finally, while Z‑scores personalise the analysis, rolling windows blur slow seasonal drifts; alternative normalisation strategies might yield subtly different results. In future analysis we will be developing a comprehensive data cleaning pipeline to standardise how we approach missing data, develop how we use baselines and how we deal with outliers.
Conclusion
What are we taking away from this? Primarily, Sleep and HRV still coexist, but their movements are hard to relate to each other. That we should treat HRV as one instrument in the big human system picture: valuable for spotting illness, over‑training or the positive impact of meditation, yet only a modest echo of last night’s time in bed. And, more generally, we should continue to shoot for rhythmic sleep habits, a balanced life and a healthy scepticism toward single‑number health promises. Sorry if I didn’t tell you anything new, but I did warn you!
Summary questions
Does a good night's sleep actually predict a higher HRV the next day?
Barely. Across 89,628 nights from 1,199 adults, the correlation between nightly sleep duration and next-day ΔHRV was r = –0.0496 — statistically significant only because of the huge sample size. A one-standard-deviation increase in sleep produced just a 0.05 SD shift in ΔHRV, well inside sensor noise. In practical terms, last night's sleep tells you almost nothing about today's HRV reading.
If I had a terrible night of sleep, how likely is my HRV to crash?
Much less likely than wearable narratives suggest. When sleep dropped below a Z-score of –1.5 (a 'particularly poor' night), a matching HRV crash followed only 6.3% of the time. The reverse — a big HRV drop preceded by awful sleep — happened 6.5% of the time. Both extremes co-occurring on the same day was rare at around 0.5%.
Do multi-day sleep trends predict HRV trends better than single nights?
Slightly, but still weakly. Three-day rolling sleep slopes correlated with HRV trajectory at r ≈ 0.12, peaking around r ≈ 0.15 for five-day slopes. After a sustained sleep drought, the probability of a negative seven-day HRV slope nudged to 52% — barely above chance. A week of improving sleep buys you only a sliver of improvement in HRV direction.
Could the sleep–HRV link just be a delayed effect I'm missing?
No. The analysis staggered sleep one, three, and five days behind HRV, and correlation coefficients drifted between –0.015 and +0.001 — essentially zero at every lag. Whether you look at same-night, three-night, or five-night windows, the conditional probabilities of paired extremes hover around 6–7%. The relationship isn't hiding in a time delay.
Are there any people whose HRV genuinely tracks their sleep?
A small minority. After within-user permutation testing with 1,000 shuffles per participant and a Benjamini–Hochberg correction, only 33 of 1,199 users (2.8%) retained a significant sleep→ΔHRV link. Their one distinguishing trait was higher night-to-night sleep variability (1.21 h vs 1.00 h SD); their mean sleep and mean HRV matched the rest of the cohort. Coupling appears to emerge mainly in people with erratic sleep schedules.
Why doesn't better sleep reliably boost my HRV the next morning?
HRV is pulled around by stimulants, emotional stress, ambient temperature, meal timing, and dozens of other inputs that can easily drown out a recovery bump from sleep. There may also be a homeostatic rebound: after a bad night the parasympathetic system can overshoot upward, while a long lie-in leaves little headroom for further gains. Add optical-sensor imprecision, and the modest sleep signal gets buried in noise.
Should I be using sleep duration to monitor recovery in a team or cohort?
Not on its own. At the group level, sleep duration explains well under 1% of variance in next-day ΔHRV — useless as a standalone recovery signal. Layering in sleep quality metrics (latency, REM proportion), training load, subjective mood, and skin temperature is far more likely to produce actionable insight than tracking hours in bed.
How should I actually use my HRV and sleep numbers day to day?
Stop expecting last night's sleep to forecast today's HRV — the effect is vanishingly small. Chase consistency over duration, since irregular bedtimes amplified the small negative coupling observed in this dataset. Track personal Z-scores rather than population averages, and weigh context (a stressful day, a long flight) more heavily than a five-minute change in last night's sleep.