We use cookies to enhance your browsing experience and analyse our traffic. By clicking “Accept All”, you consent to our use of cookies according to our Cookie Policy. You can change your mind any time by visiting out cookie policy.
We analysed wearable data from over 3,000 users to measure the New Year's resolution effect on physical activity. The results? Steps jumped 13.3% on January 1st, but the median elevated period lasted just 2 days. The most striking finding: less-active individuals showed the biggest gains (+25% in active minutes), while already-active users barely changed. Here's what the data reveals about motivation, habit formation, and why small wins beat ambitious targets.
We tracked 3,000+ users through January – using wearable data to measure whether the "New Year's resolution effect" is real, how long it lasts, and who it actually affects.
The spike is real, but short-lived – steps jumped 13.3% on January 1st, yet most users returned to baseline within 48 hours. Only 1 in 4 sustained elevated activity past day 4.
The surprise: it's not your fittest users changing – the least-active quartile showed +25% gains while already-active users barely moved. The resolution effect targets people who weren't exercising before.
The Resolution Effect: What Our Data Reveals About Activity Upticks
Did you make a New Year’s resolution? If so, have you maintained it?
I, Alistair Brownlee, made two health-based resolutions. Firstly, to sleep for 24 hours for each three-night period. I’ve already failed at that one. And secondly, to do some form of exercise every day, which thankfully, is still intact.
The classic "New Year's resolution effect" – that surge of motivation on January 1st followed by a quick fade – is something we’ve all experienced or observed. But does the data support it? Using aggregated insights from a large cohort of users tracked through wearable devices and platforms like Terra API, we wanted to assess whether we could detect a noticeable change in the data.
Our analysis focuses on 2025 data, comparing activity metrics on January 1st, and the days following, to other days in our January - March data set, while controlling for day-of-week effects. We examined steps, active minutes, and distance, applying rigorous statistical methods to separate real behavioral changes from noise. We found a modest, short-lived uptick, strongest among certain users.
We should say that, as we studied anonymised users, we don’t know if any of them actually made a New Year’s Resolution to increase their activity. It would, of course, be more interesting to study how those who made a resolution changed their behavior. Instead, we have a large data set that allows us to determine whether the population as a whole changed their routines and to see the percentage of individuals who demonstrated a different pattern. Then determine what was unique about these pattern changes to see if there is anything interesting we can learn.
Get the latest Terra Research reports and insights every week as soon as they're published.
This 13.3% increase in steps is the most pronounced signal of New Year's motivation. People clearly took extra walks, hit the treadmill, or got moving in ways that added up to more total steps.
Active minutes and distance showed smaller lifts:
Active Minutes: +1.3% (not significant, p=0.74)
Distance: +2.6% (not significant, p=0.65)
These differences are positive but fall short of statistical significance, suggesting that while more people were moving, the extra effort didn’t always translate into longer sessions or greater overall distance on that single day. This is obviously not proof of a New Year’s resolution effect, as January 1st is a holiday in most Western countries. So we would expect to find a change in behaviour. This data probably just confirms that New Year’s Day walks are a thing!
Day-of-Week Aware Analysis
To avoid bias from weekday/weekend patterns, we benchmarked for day of the week and weekends. For each user, we calculated their personal median activity (January through March 31) and flagged days that exceeded this baseline by 5% or more.
On January 1st:
Steps: 50.9% of users (653 out of 1,282) were above threshold
Active Minutes: 47.6% of users (1,550 out of 3,259)
Distance: 47.2% of users (1,217 out of 2,579)
Roughly half of users showed elevated activity on New Year's Day itself. But how long did it last? The duration of these elevated periods was short for most:
Mean duration: ~2.7–2.8 days across metrics
Median duration: 2.0 days
Maximum duration: 21–31 days
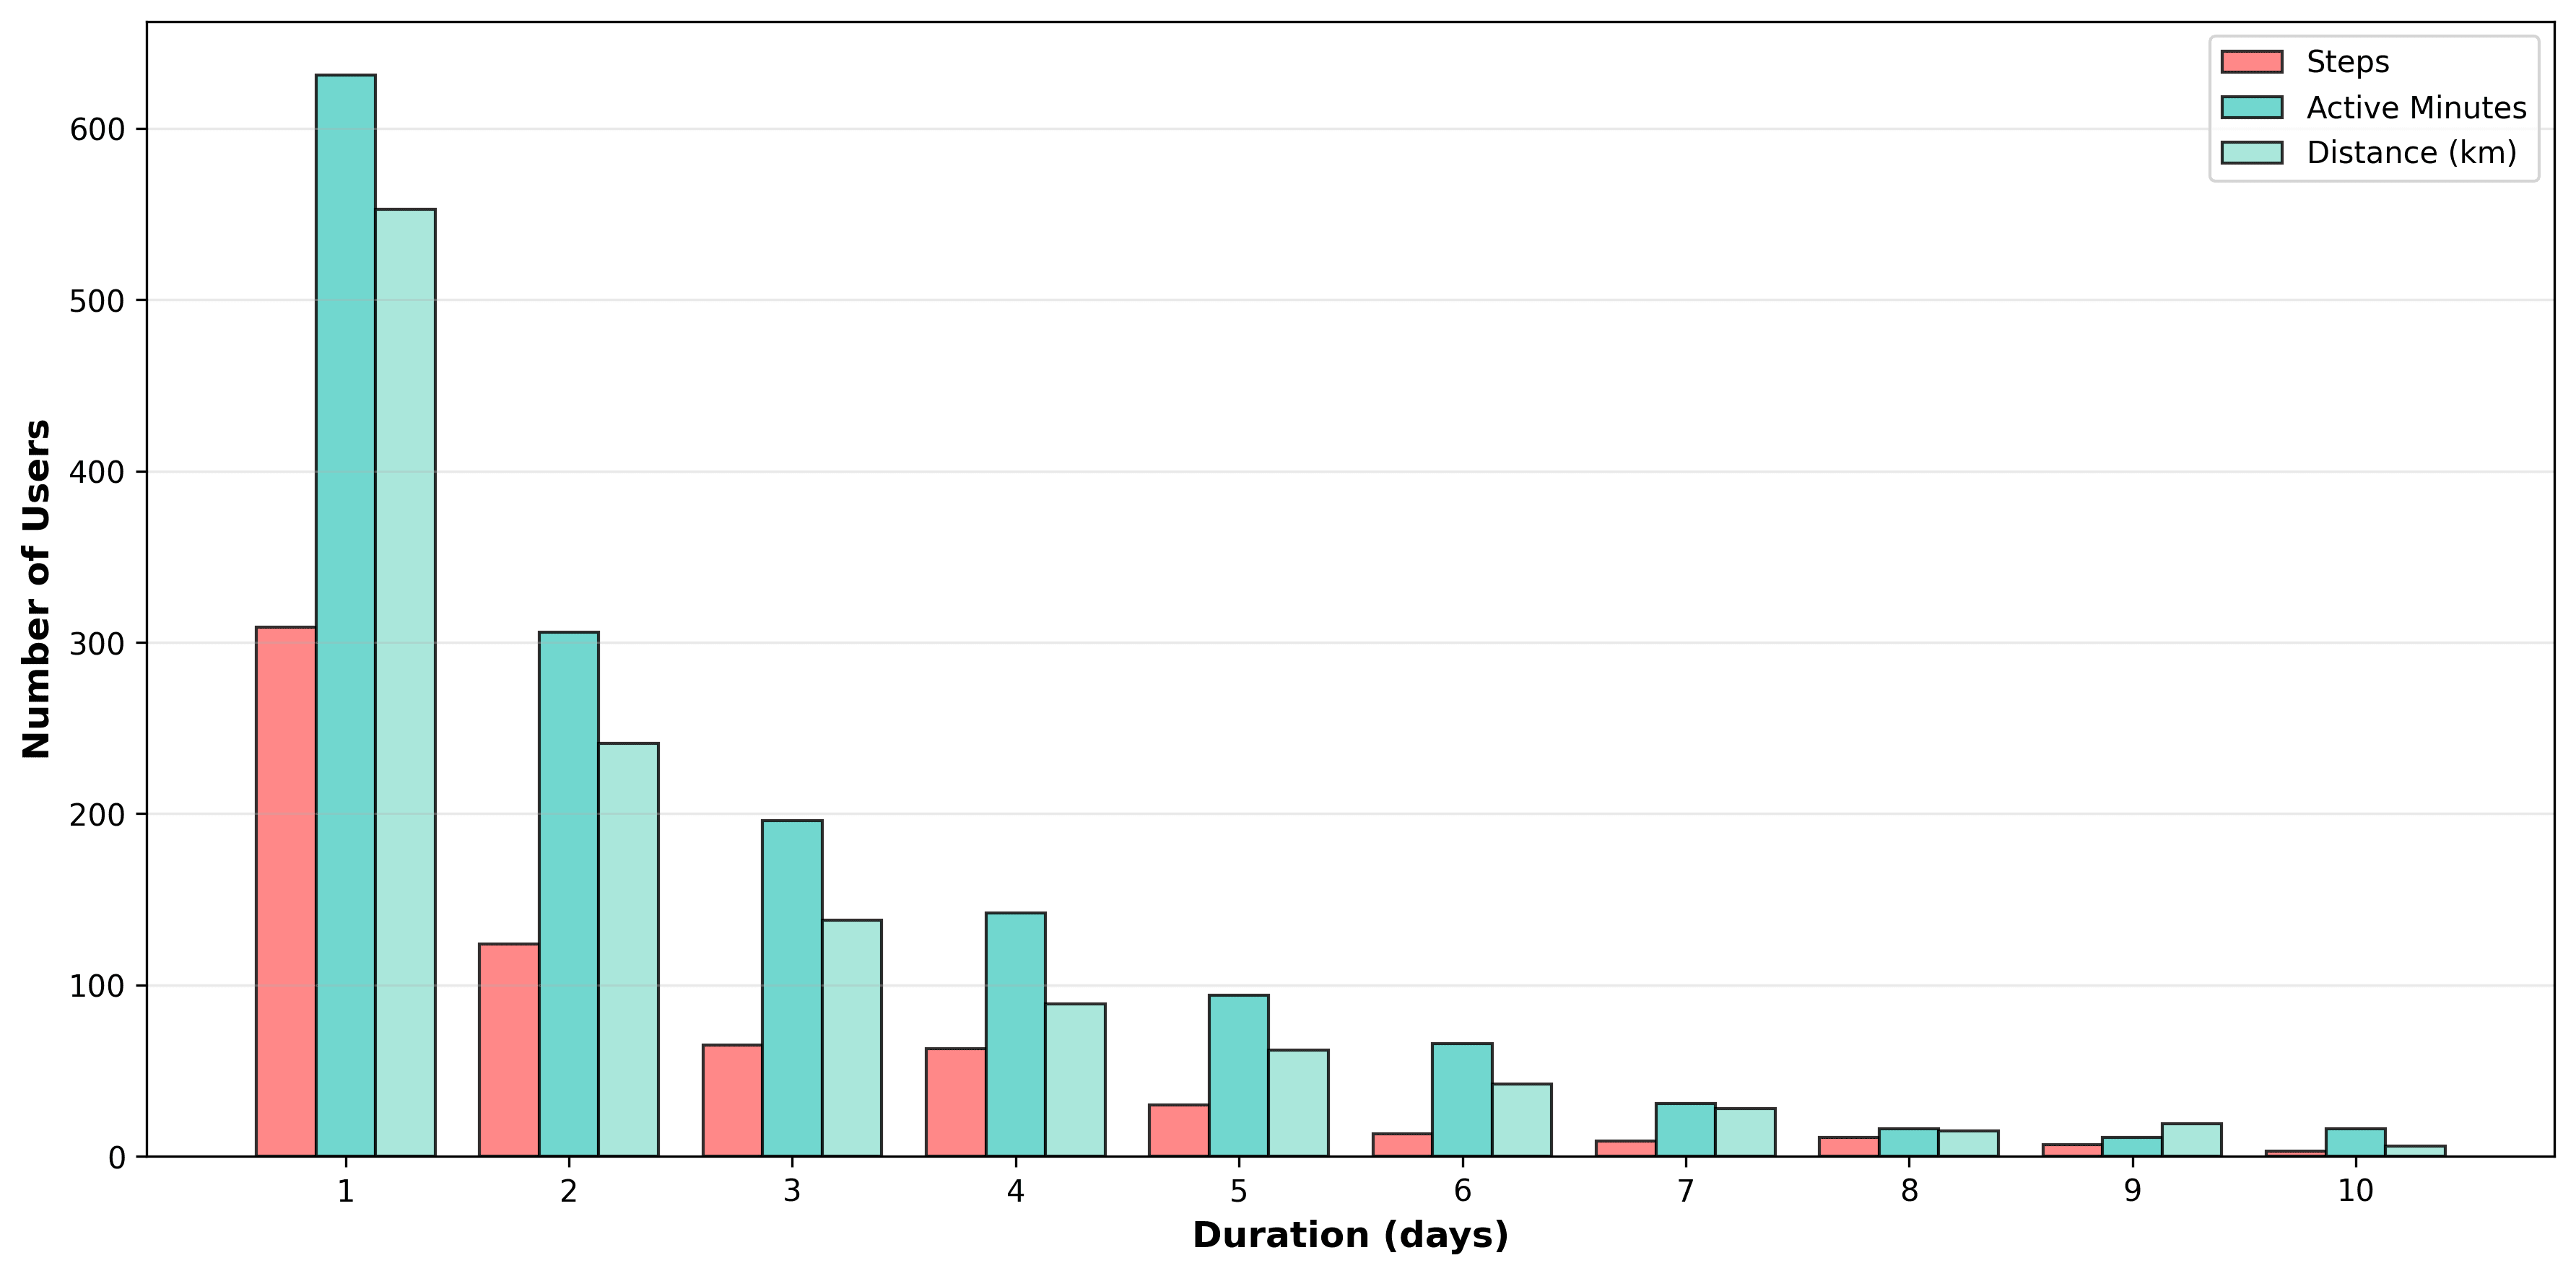
Figure 1: Distribution of Elevated Activity Period Durations. Bar chart illustrates the number of users maintaining activity above their personal baseline for consecutive days starting January 1st. The vast majority of elevations were short, with a sharp peak at 1 day (especially for active minutes and distance), and a rapid tail-off after 4 days.
Most users who showed an increase in activity on January 1st (1 day: 40–47%, 2 days: 19–20%) returned to their normal levels after 1 or 2 days. About one in four maintained higher activity for at least 4 days, indicating that, for some, there is a real, perceptible trend difference.
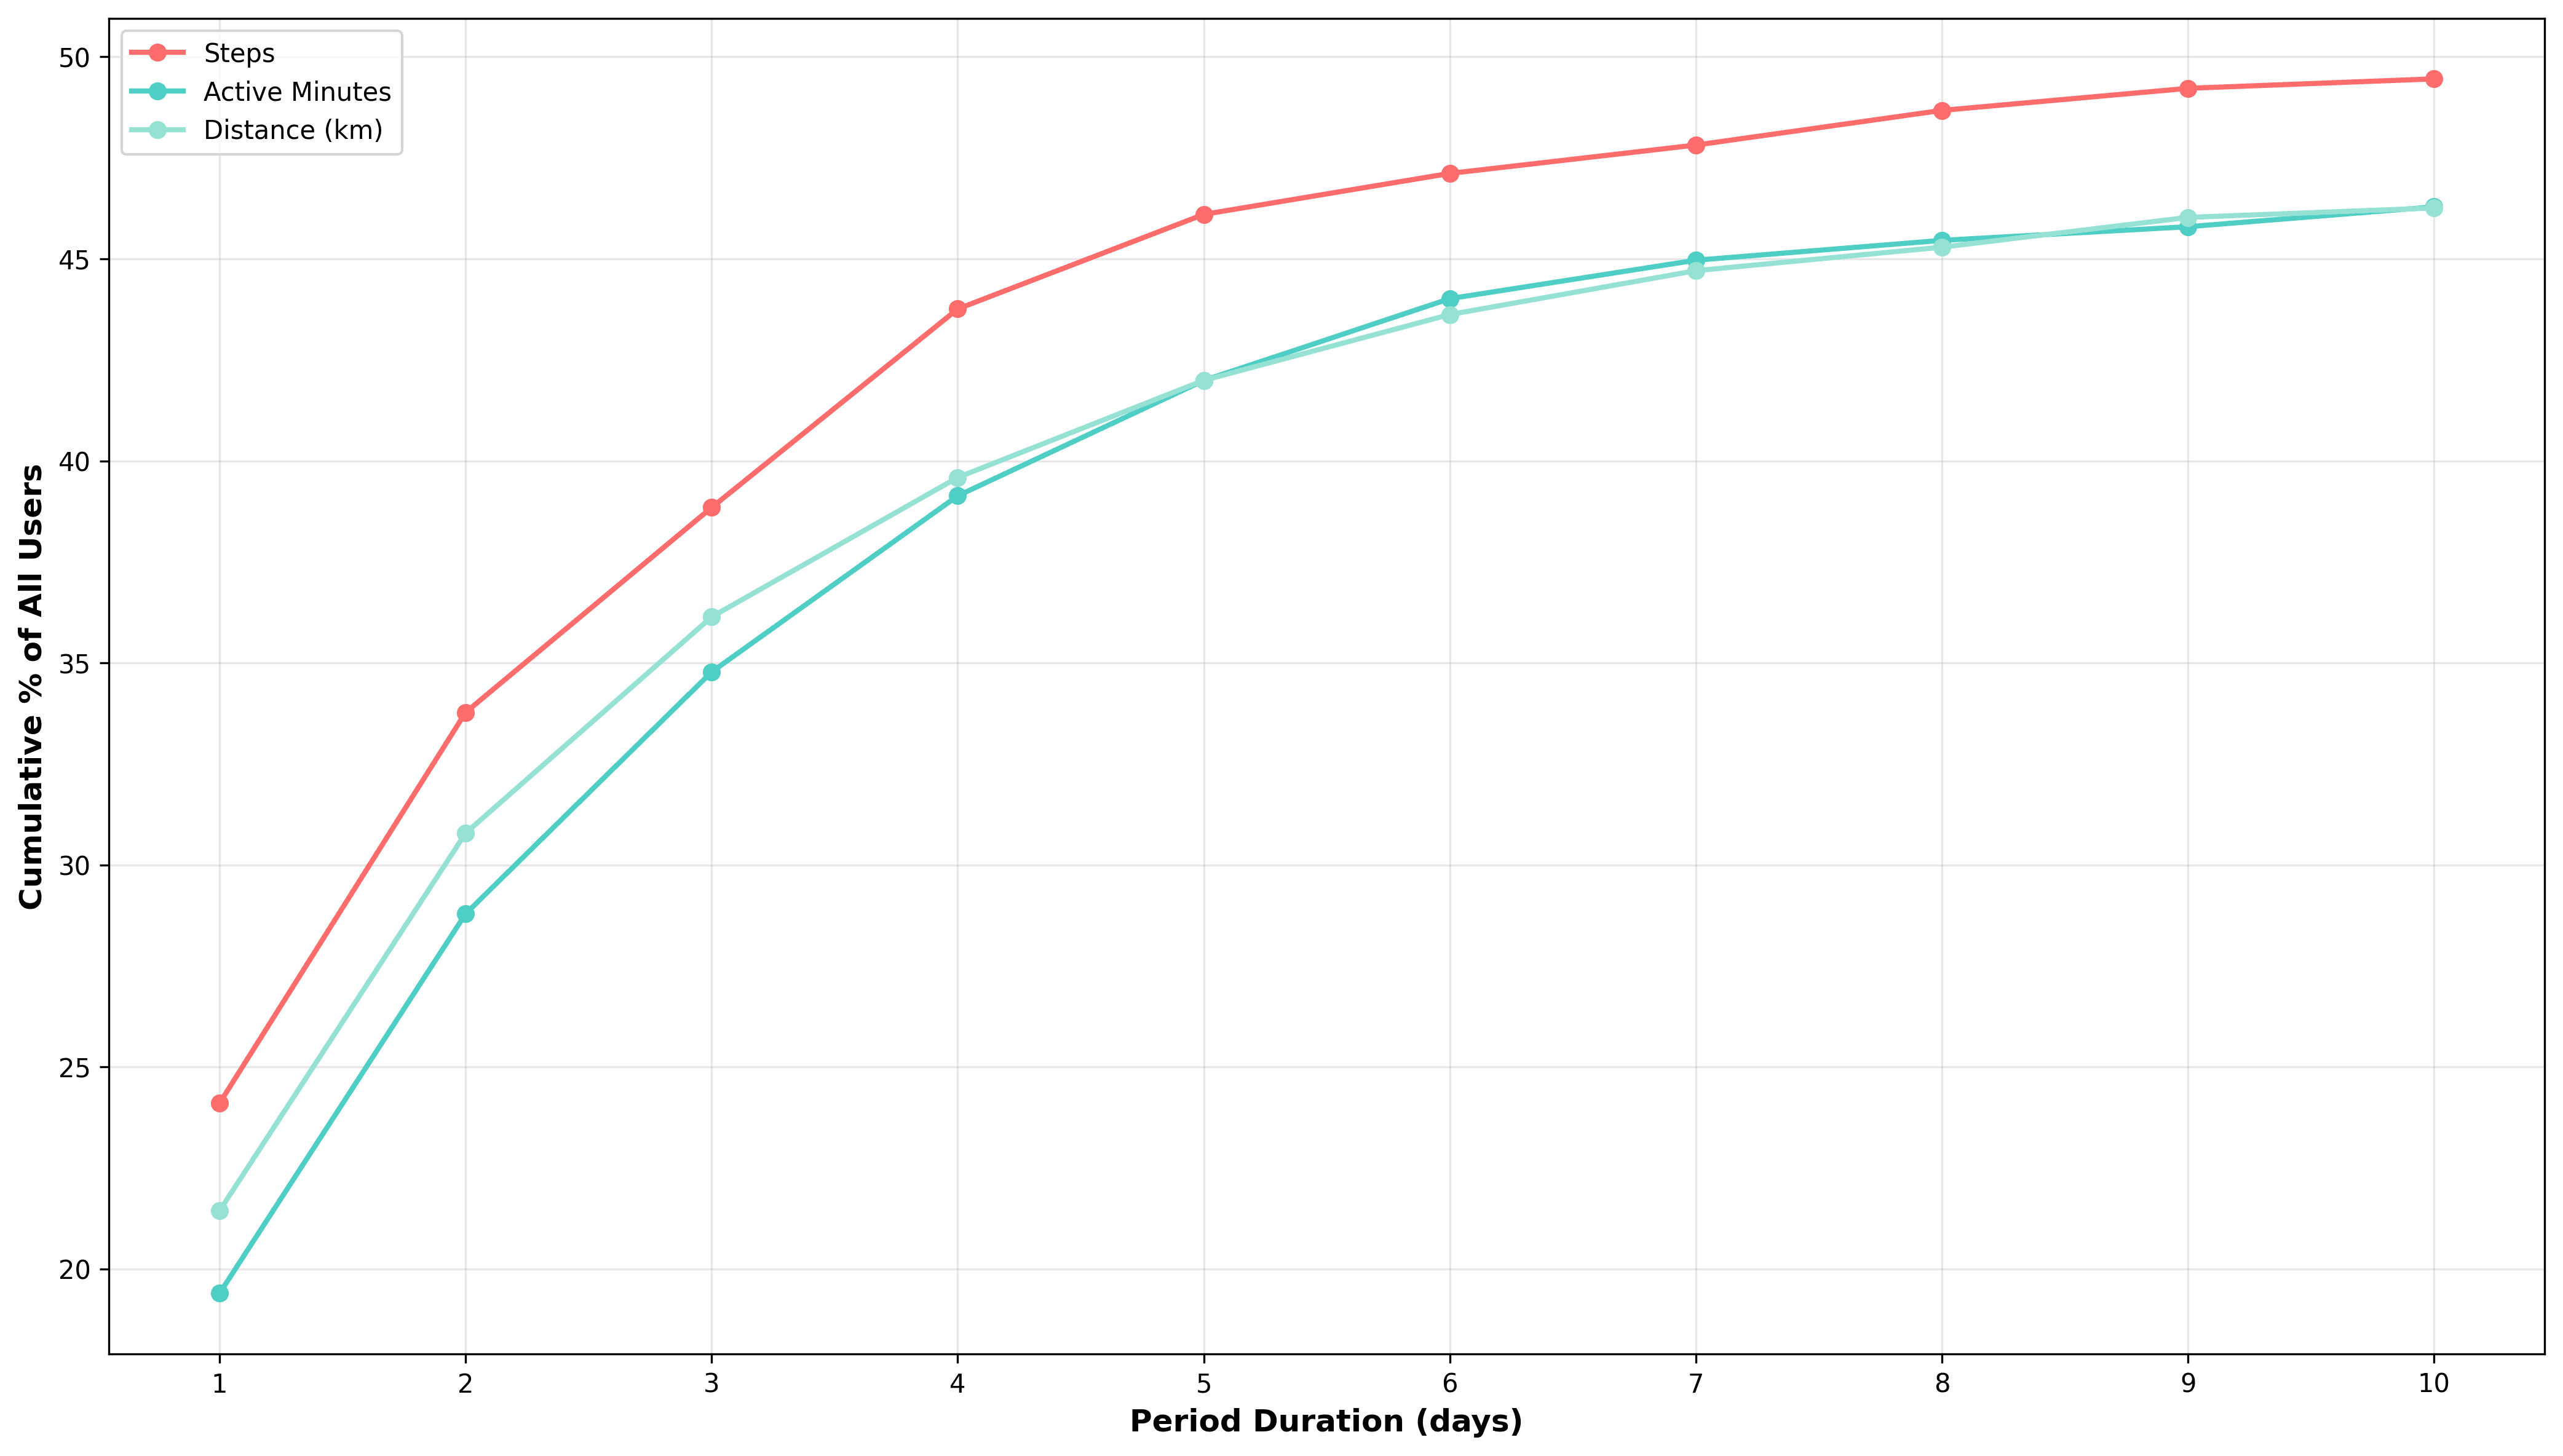
Figure 2: Cumulative Percentage of Users Maintaining Elevated Activity. This line chart shows the running total of users (as a percentage of all with data) who stayed above the threshold for at least the specified number of days. Steps show the steepest early rise, while active minutes and distance catch up more gradually.
How did people increase their activity?
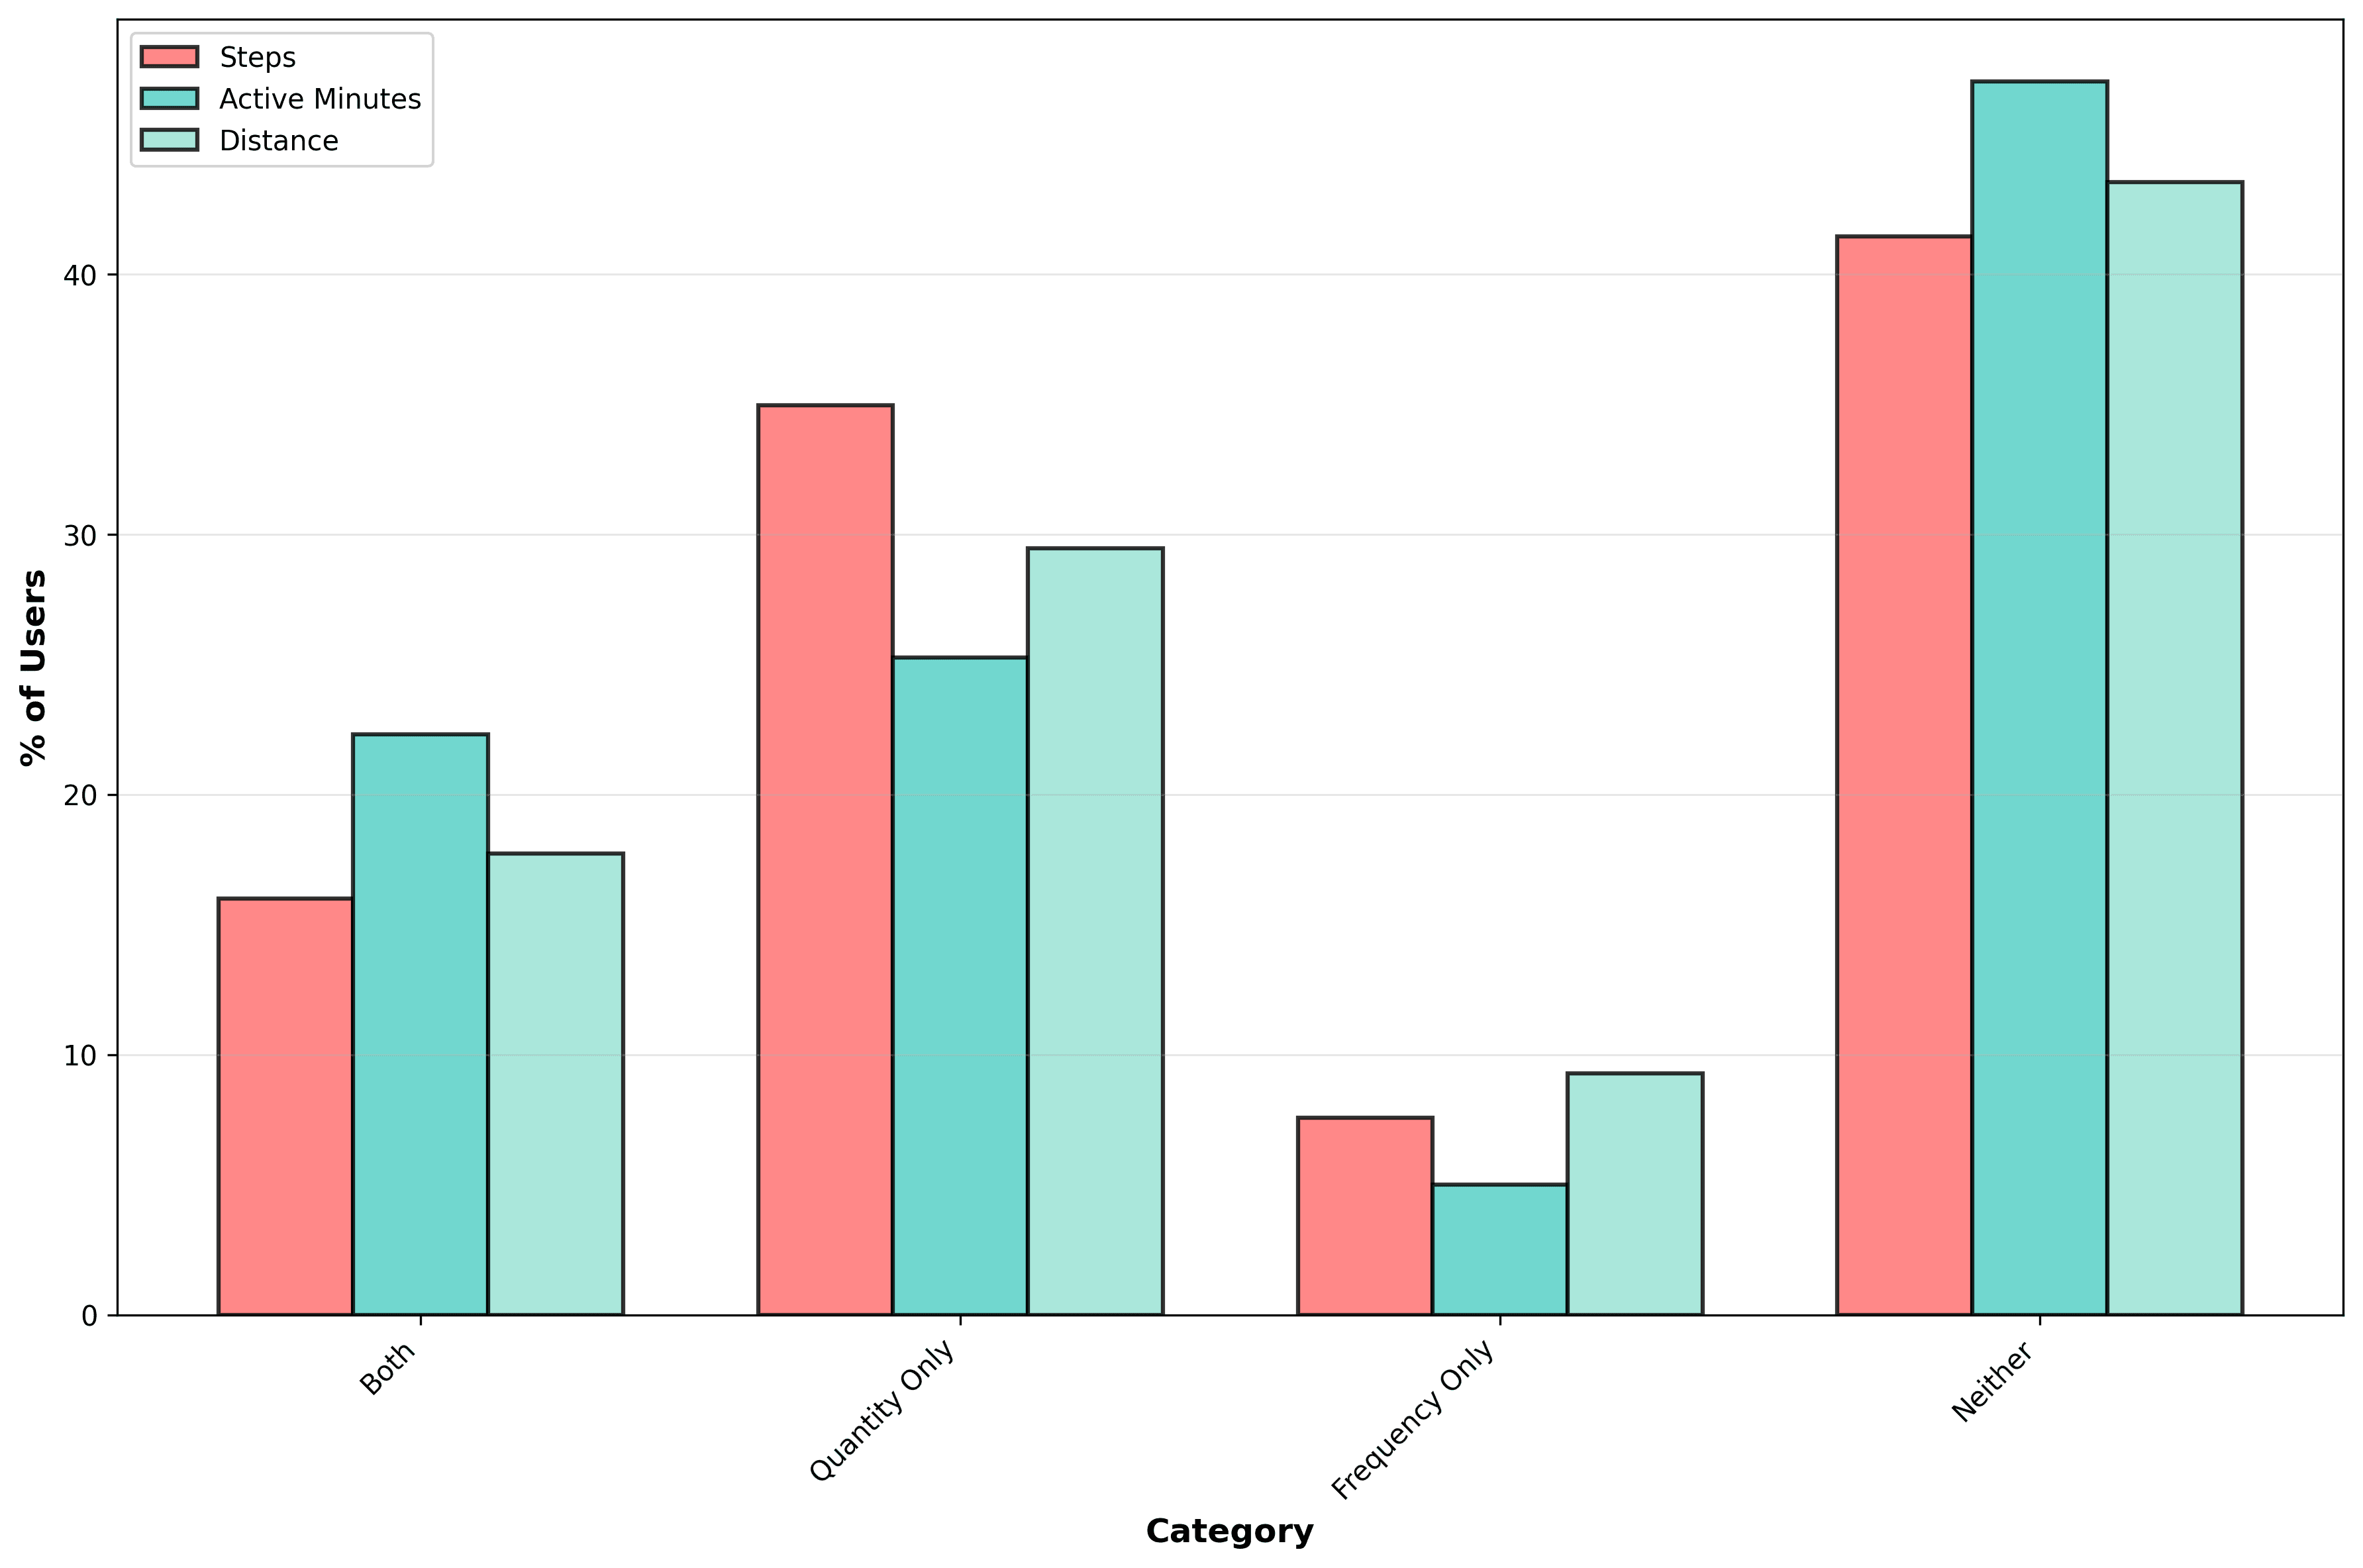
The standout pattern is that Quantity Only was the most common way people boosted activity (25–35% of users), while adding more sessions without increasing intensity (Frequency Only) was the least common (5–9% of users). A solid portion (16–22%) did both, but nearly half of users (41–47%, rightmost tall bars) showed no meaningful change in either dimension.
This tells a practical story about changes in New Year's activity: most people preferred the easier path of extending or intensifying their existing workouts (e.g., a longer walk or a harder gym session) rather than adding brand-new sessions to their schedules. It suggests that time constraints or habit inertia play a big role; going longer and harder in what you're already doing feels more doable than carving out extra time slots. For those building sustainable habits, this data hints that focusing on quality/intensity upgrades might be a smarter starting point than forcing more frequent workouts right away. We are back at a principle we see time and again in this research. Small and consistent wins when it comes to health.
Figure 3: This grouped bar chart shows how users who exhibited periods of increased activity on or around January 1st did so across three metrics: steps. active minutes, and distance.
The population vs the individual
When analysing data like this, we try to distinguish genuine behavioural shifts - like a true New Year's motivation boost - from statistical flukes or random daily variations. We did this in two main ways. Firstly, by population-level significance (did the overall group trends hold up across the board?). Then we looked at individual-level significance (did each person's January 1st spike stand out against their own typical patterns?)
The population-level test has much greater statistical power because it averages thousands of users together, making even small, widespread increases (like an extra 700–800 steps across many people) highly detectable. In contrast, individual tests compare just one day against each person's own baseline, where day-to-day noise is much larger and makes it harder for most personal increases to reach statistical significance. This tells us the New Year's effect at a population level was real but subtle
At the person-by-person level, we ran statistical tests to determine whether a user's January 1st activity was significantly higher than their personal baseline (p < 0.05). This filters out one-off anomalies.
Steps: 44.1% of users showed a statistically significant increase (566 out of 1,282 total users with data).
Active Minutes: 45.4% (1,479 out of 3,259 users).
Distance: 42.2% (1,089 out of 2,579 users).
In short, about 42–45% of users had a "real" elevation on New Year's Day, not just luck or a random good day. This is a strong hint that resolutions did drive action for nearly half the group.
Statistical significance tells us if something happened, but Cohen's d measures how much it mattered, like the practical size of the change. Our effect sizes were consistently small, which fits the idea of a subtle "nudge" rather than a seismic shift in habits.
Steps: -0.009 (negligible — basically no meaningful group difference after accounting for variance).
Active Minutes: 0.038 (small).
Distance: 0.123 (small).
These tiny numbers suggest the resolution effect was widespread but gentle: think a collective extra stroll or slightly longer jog, not everyone suddenly training for a marathon.
Who Increases? Less Active Users Lead the Charge
We found that the increase in activity is not uniform. Less-active users, those in the lowest baseline quartiles, were more likely to increase their steps. The lowest quartile had a 20% increase rate; the highest quartile only 2%. Comparing the least active quartile to the most active quartile:
Active Minutes: 63.6% vs. 29.9%
Distance: 46.4% vs. 39.5%
Less-active individuals showed the largest behavioural shift. Already-active users tended to maintain rather than amplify their routines. There could be a regression to the mean effect here - it’s more likely that previously low activity users can, and do, increase their activity levels.
Interestingly, this trend almost reversed for distance. Where the most and least active quartiles have a similar (4-5%) increase.
What’s happening here? Our theory is that people walk more on January 1st, but don’t necessarily engage in more intense activities. But we are guessing!
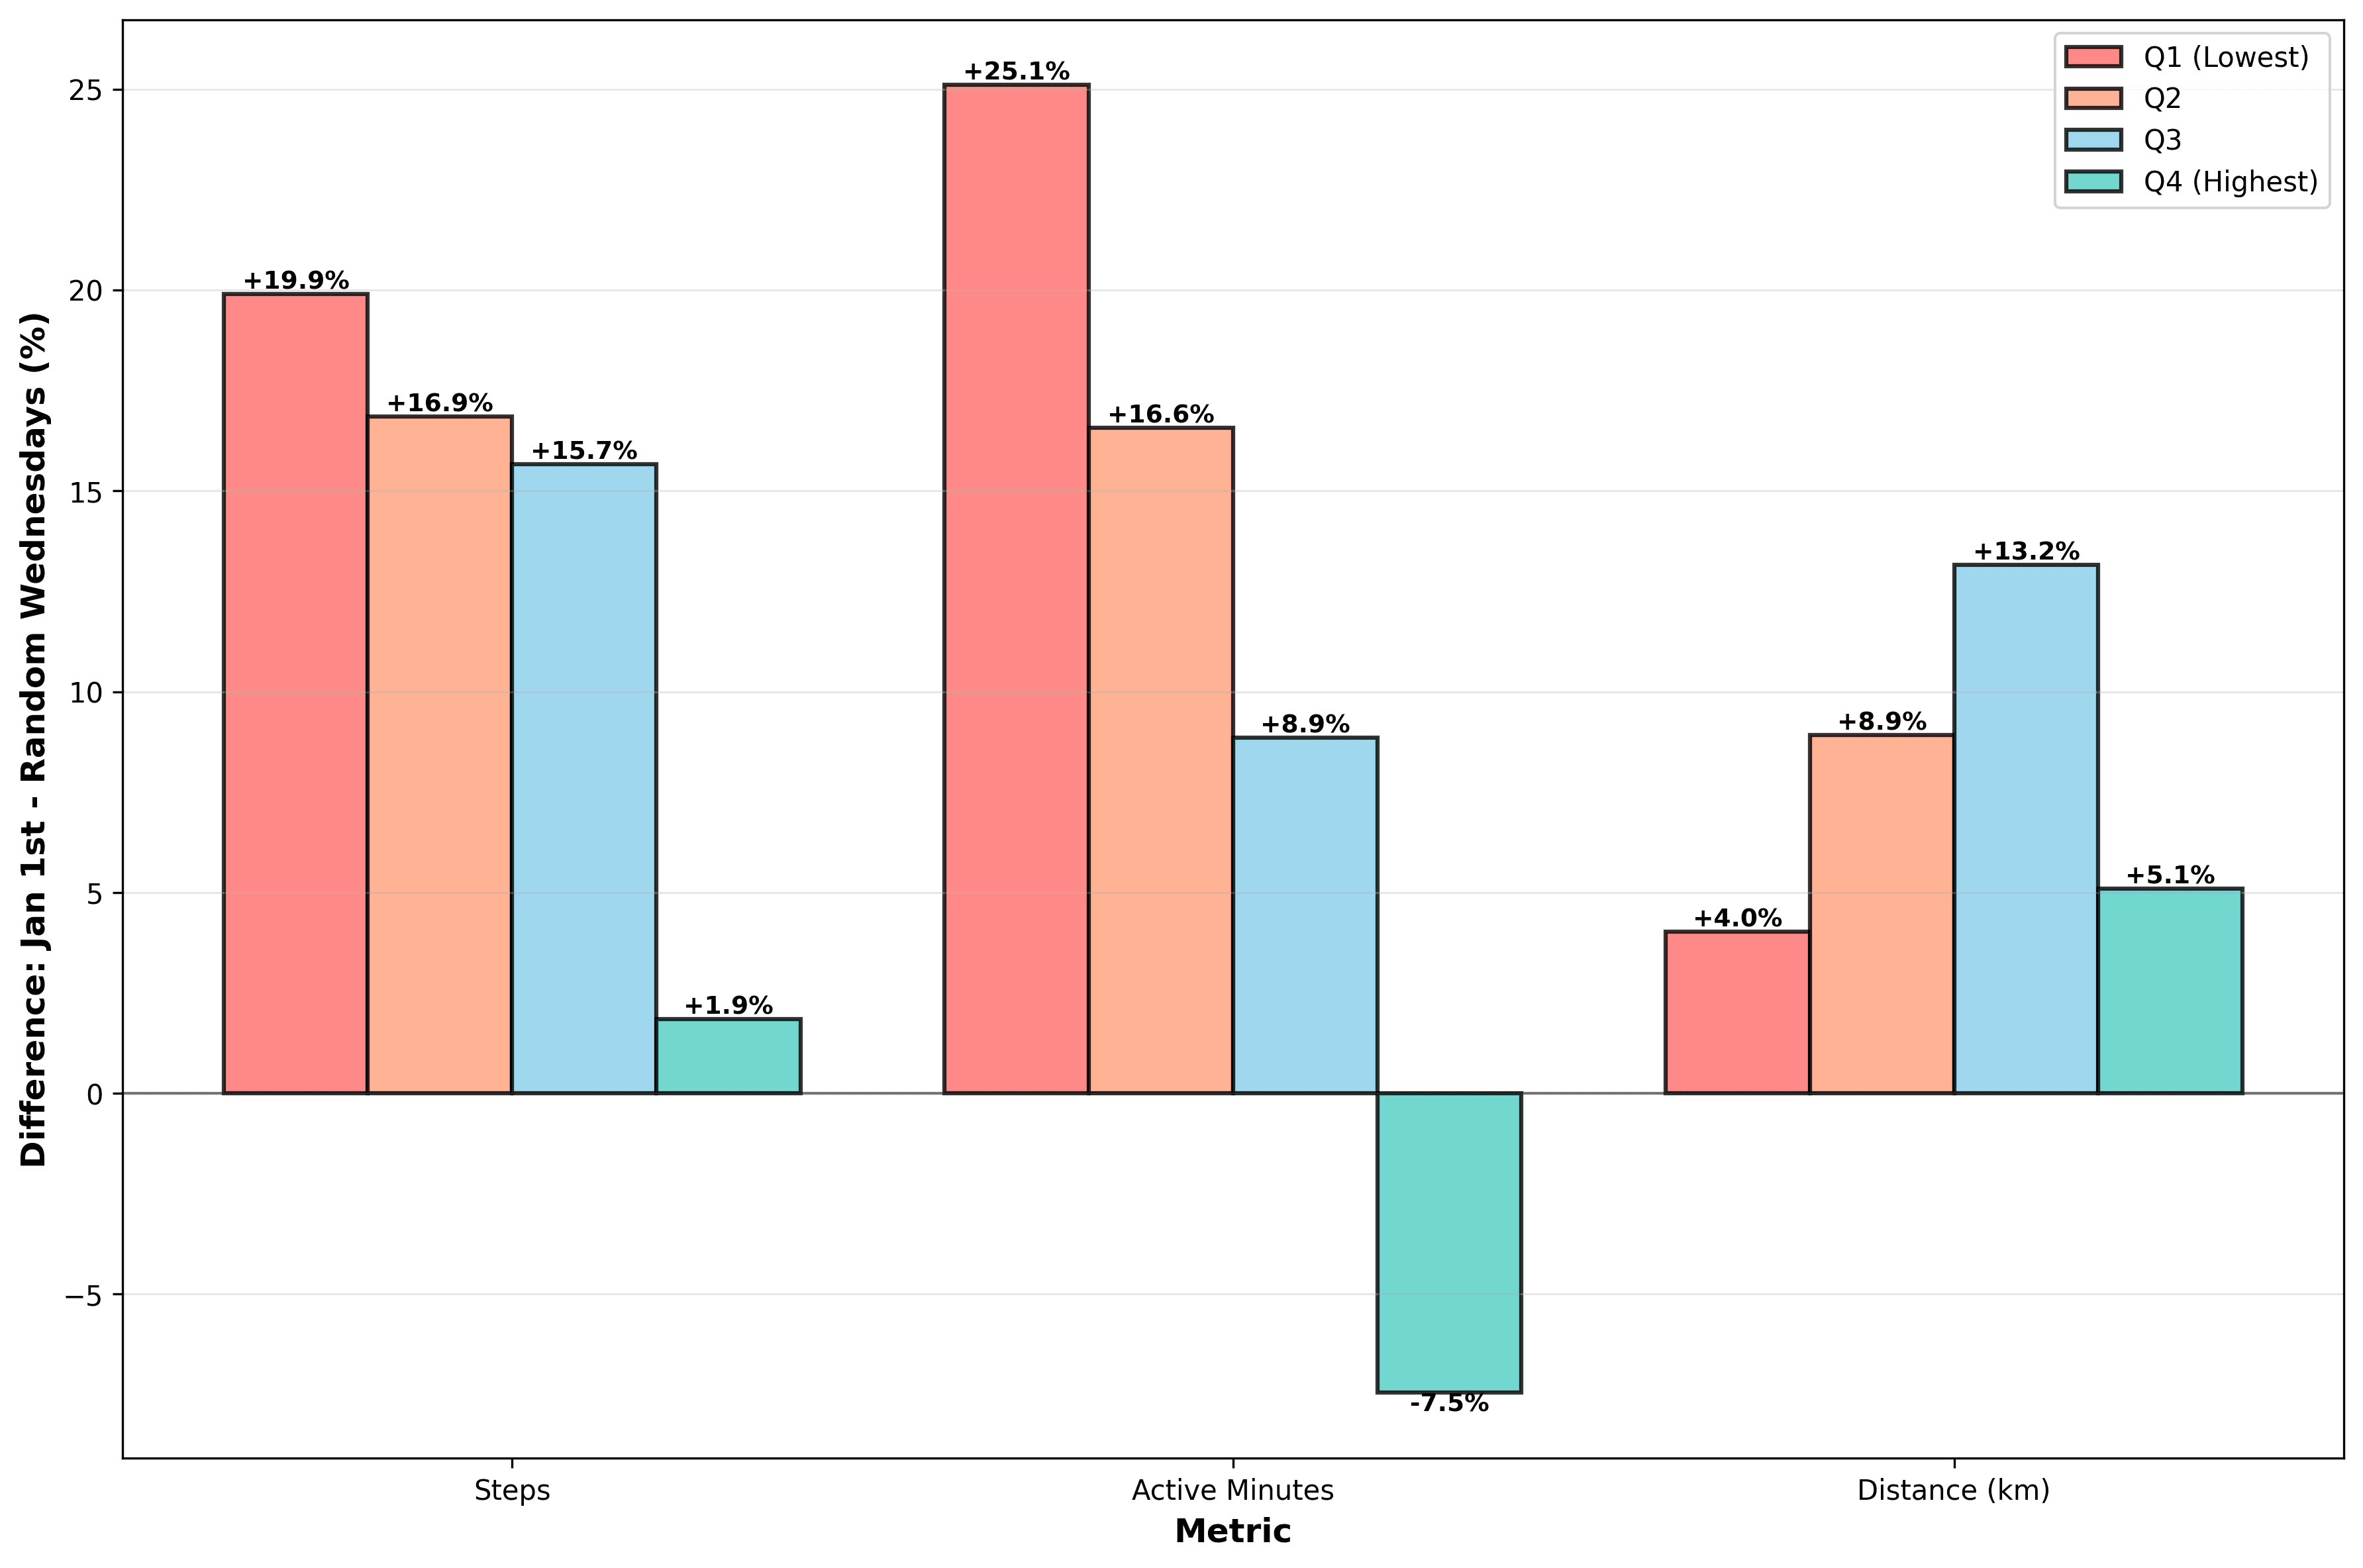
Figure 4 shows that less-active users (in the lowest baseline quartile, Q1) were far more likely to increase their activity on January 1st than on a typical Wednesday, with differences up to +25.1% in active minutes. In contrast, the most active users (Q4) showed little to no extra boost, revealing that the New Year's resolution effect primarily motivates people who weren't already very active to get moving.
Is It Just Regression to the Mean? The Evidence Says No
Regression to the mean would show up among the lowest-activity users, increasing activity purely by chance, and a high-activity day might follow a low one purely by chance. The results showed that those in the lowest quartile had a high coefficient of variation in the number of steps (much higher than the Q4 activity users), suggesting a regression-to-the-mean effect on this analysis. But our tests show the January 1st effect is real. Increase rates on January 1st were 15–25 percentage points higher than on random Wednesdays (p<0.001). The effect was specific to January 1st, not a random fluctuation. While variance plays a role, the data confirms a genuine behavioural response tied to the New Year's "fresh start" mindset.
What This Means
Our analysis shows a New Year's resolution effect on activity: about half of users increased activity on January 1st, with the strongest signal in steps and among less-active individuals. Yet for most, the boost lasted only days, not weeks. This aligns with broader patterns where enthusiasm peaks early but fades quickly.
The big unknown here is how many people in our sample actually set a Resolution to increase their activity. It could have been every user, none, or more likely somewhere in the middle! So we don’t know how many of those who set an exercise resolution stuck to them.
The good news is that the 24–27% who sustained elevated activity for 4+ days prove persistence happens for many. In the future, it would be great to test if interventions (apps, gym membership, etc.) can help with these behaviour trends, by both behavioural nudges and by providing deeper insights – tracking strain scores, spotting early burnout. These are the kinds of insights that could really help users and Terra customers create meaningful health impact.
Whether we were part of the January spike or watching from the sidelines, the numbers remind us: every day is an opportunity to move a little more. Remember, this analysis was set up to determine whether we could see different patterns in activity on January 1st and the days that followed. But we can all start a new activity, “trend”, or resolution in any of the other 365 days of the year!
Summary questions
Is the New Year's resolution effect actually real in wearable data?
Yes, but it's subtle. On January 1st 2025, mean steps were 6,452 versus 5,694 on other days — a statistically significant 13.3% increase (p=0.0008). Active minutes (+1.3%) and distance (+2.6%) trended up but didn't reach significance, suggesting people walked more rather than training harder.
How long does my January motivation typically last?
Not long. Across the cohort, the median duration of elevated activity starting January 1st was just 2.0 days, with a mean of 2.7–2.8 days. Roughly 40–47% of users who showed a bump returned to baseline after a single day, and only about a quarter sustained elevation for 4+ days.
Who actually increases their activity on New Year's Day?
Less-active people drive the effect. Users in the lowest baseline quartile increased their steps at a 20% rate versus just 2% in the highest quartile, and active minutes jumped 63.6% vs 29.9% between Q1 and Q4. Already-active users mostly maintained their routines rather than amplifying them.
Did people add new workouts or just extend existing ones?
They extended what they were already doing. "Quantity Only" — going longer or harder in existing sessions — was the most common pattern (25–35% of users), while "Frequency Only" (adding new sessions) was the least common at 5–9%. Time constraints and habit inertia appear to favor intensifying current routines over carving out new slots.
Is this just regression to the mean for low-activity users?
No. While the lowest quartile did show high coefficient of variation in steps, increase rates on January 1st were 15–25 percentage points higher than on random Wednesdays (p<0.001). The effect was specific to January 1st, confirming a genuine "fresh start" behavioural response rather than statistical noise.
How many users showed a real personal spike, not just a lucky day?
At the individual level with p<0.05 testing against personal baselines, 44.1% of users showed significant step increases, 45.4% for active minutes, and 42.2% for distance. So roughly 42–45% had genuine elevations on New Year's Day — close to half the cohort responding meaningfully.
How big was the effect for each individual?
Small. Cohen's d values were 0.123 for distance, 0.038 for active minutes, and essentially zero (-0.009) for steps after accounting for variance. The resolution effect was widespread but gentle — a collective extra stroll, not a population suddenly training for marathons.
What's the practical takeaway for building sustainable activity habits?
Start with quality, not frequency. The data shows people overwhelmingly prefer extending existing sessions over adding new ones, and the 24–27% who maintained elevated activity for 4+ days prove sustained change is achievable. Small consistent upgrades to what you already do beats forcing brand-new workout slots — and any of the other 364 days works just as well as January 1st.