We use cookies to enhance your browsing experience and analyse our traffic. By clicking “Accept All”, you consent to our use of cookies according to our Cookie Policy. You can change your mind any time by visiting out cookie policy.
We analyzed 93 days of continuous sleep data across Fitbit, Apple Watch, and Garmin users to answer a simple question: who actually wears their wearable device? While Garmin offers superior data fidelity, our analysis reveals it suffers from the lowest user adherence (69.3%).
Wearable sleep compliance is high in real-world settings, with Fitbit users in particular showing rates that meet or exceed those seen in structured clinical studies.
Weekly usage patterns are consistent across devices, with Thursday the strongest night and Saturday the weakest, highlighting subtle but predictable rhythms in user behavior.
These devices are not only accurate but also reliably used, making them powerful tools for sleep and recovery research outside the lab.
How Do People Use Their Wearables?
At Terra Research, we care not just about measurement accuracy, but also about how people interact with their devices over time. That real-world usage determines the quality and consistency of data we can rely on — critical for meaningful sleep and recovery research. It’s also useful information for our terra customers. Building a product based on daily recovery and sleep data? Encouraging the use of a particular wearable device might provide more consistent data.
This analysis focuses entirely on sleep (overnight) data, asking a simple but essential question: how often do users actually log sleep data? I used data from four wearables over 93 days, from 1 May to 1 August 2025. I only examined compliance between the first day of device use and the final day of the period. This was important because many users were onboarding during May and June, particularly those using Fitbit.
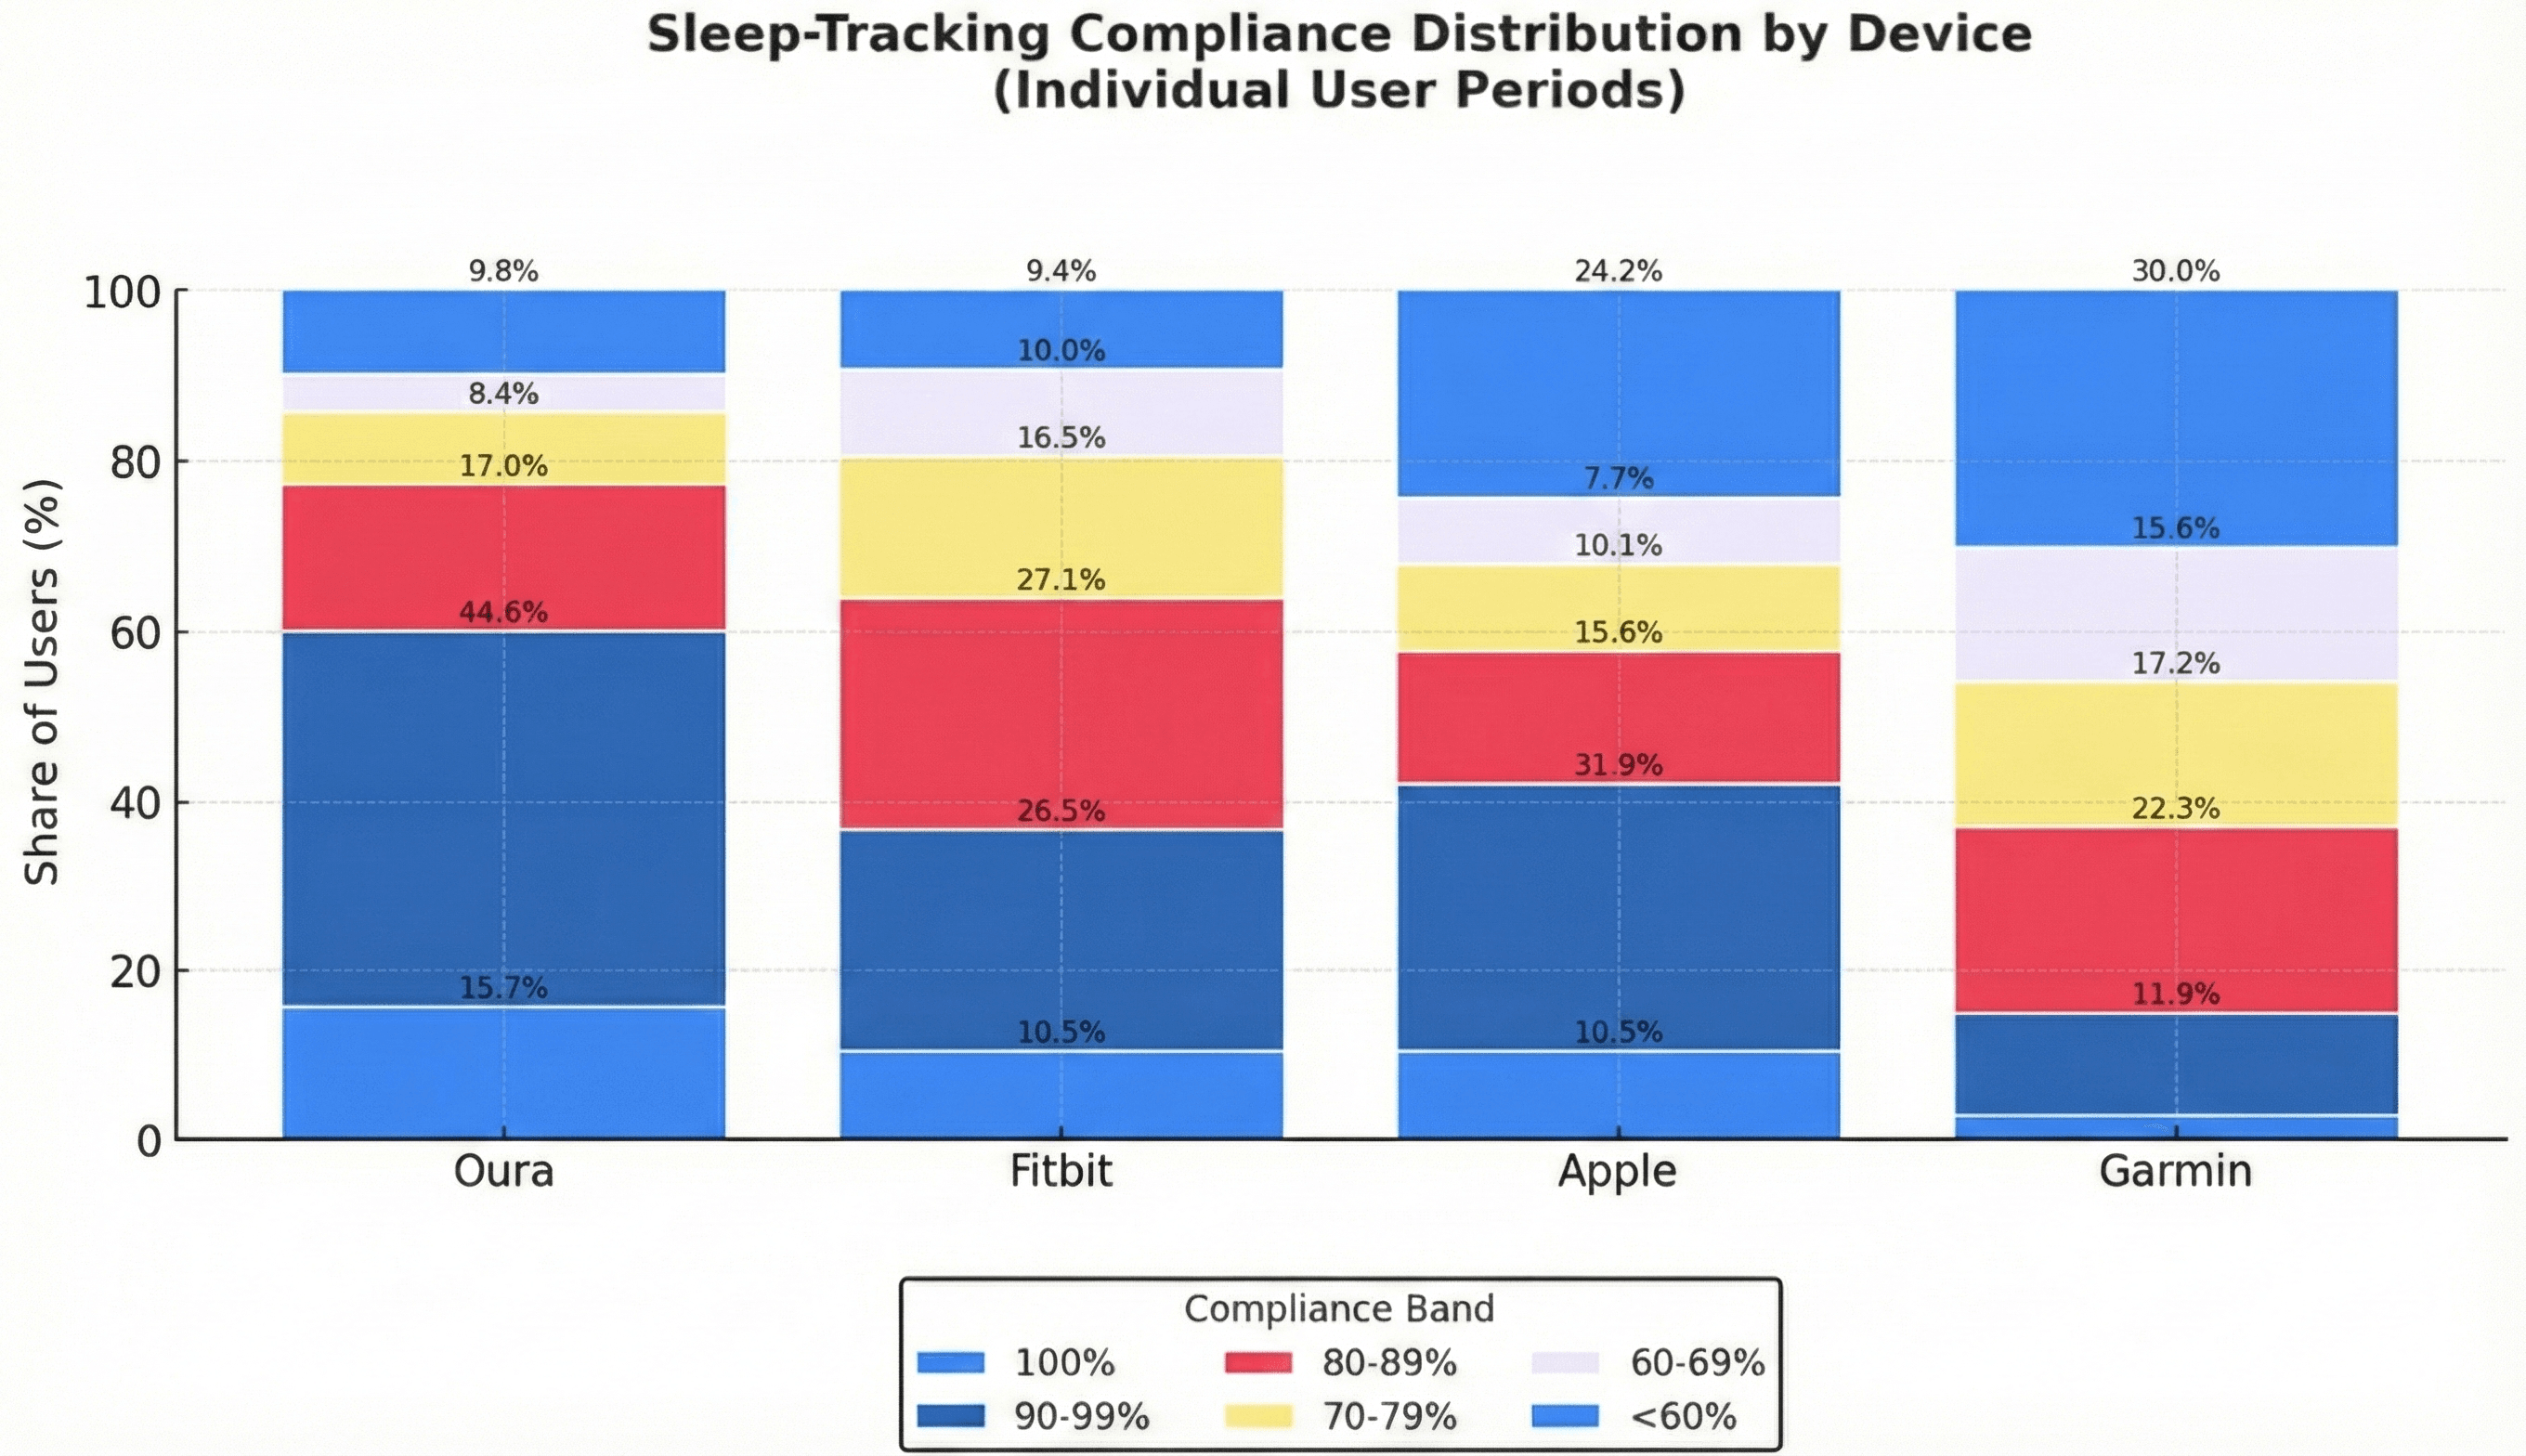
Figure 1: Fitbit users are also highly compliant. Apple shows more spread, with many high-compliance users but also a large low-compliance group. Garmin trails with the lowest overall compliance.
Get the latest Terra Research reports and insights every week as soon as they're published.
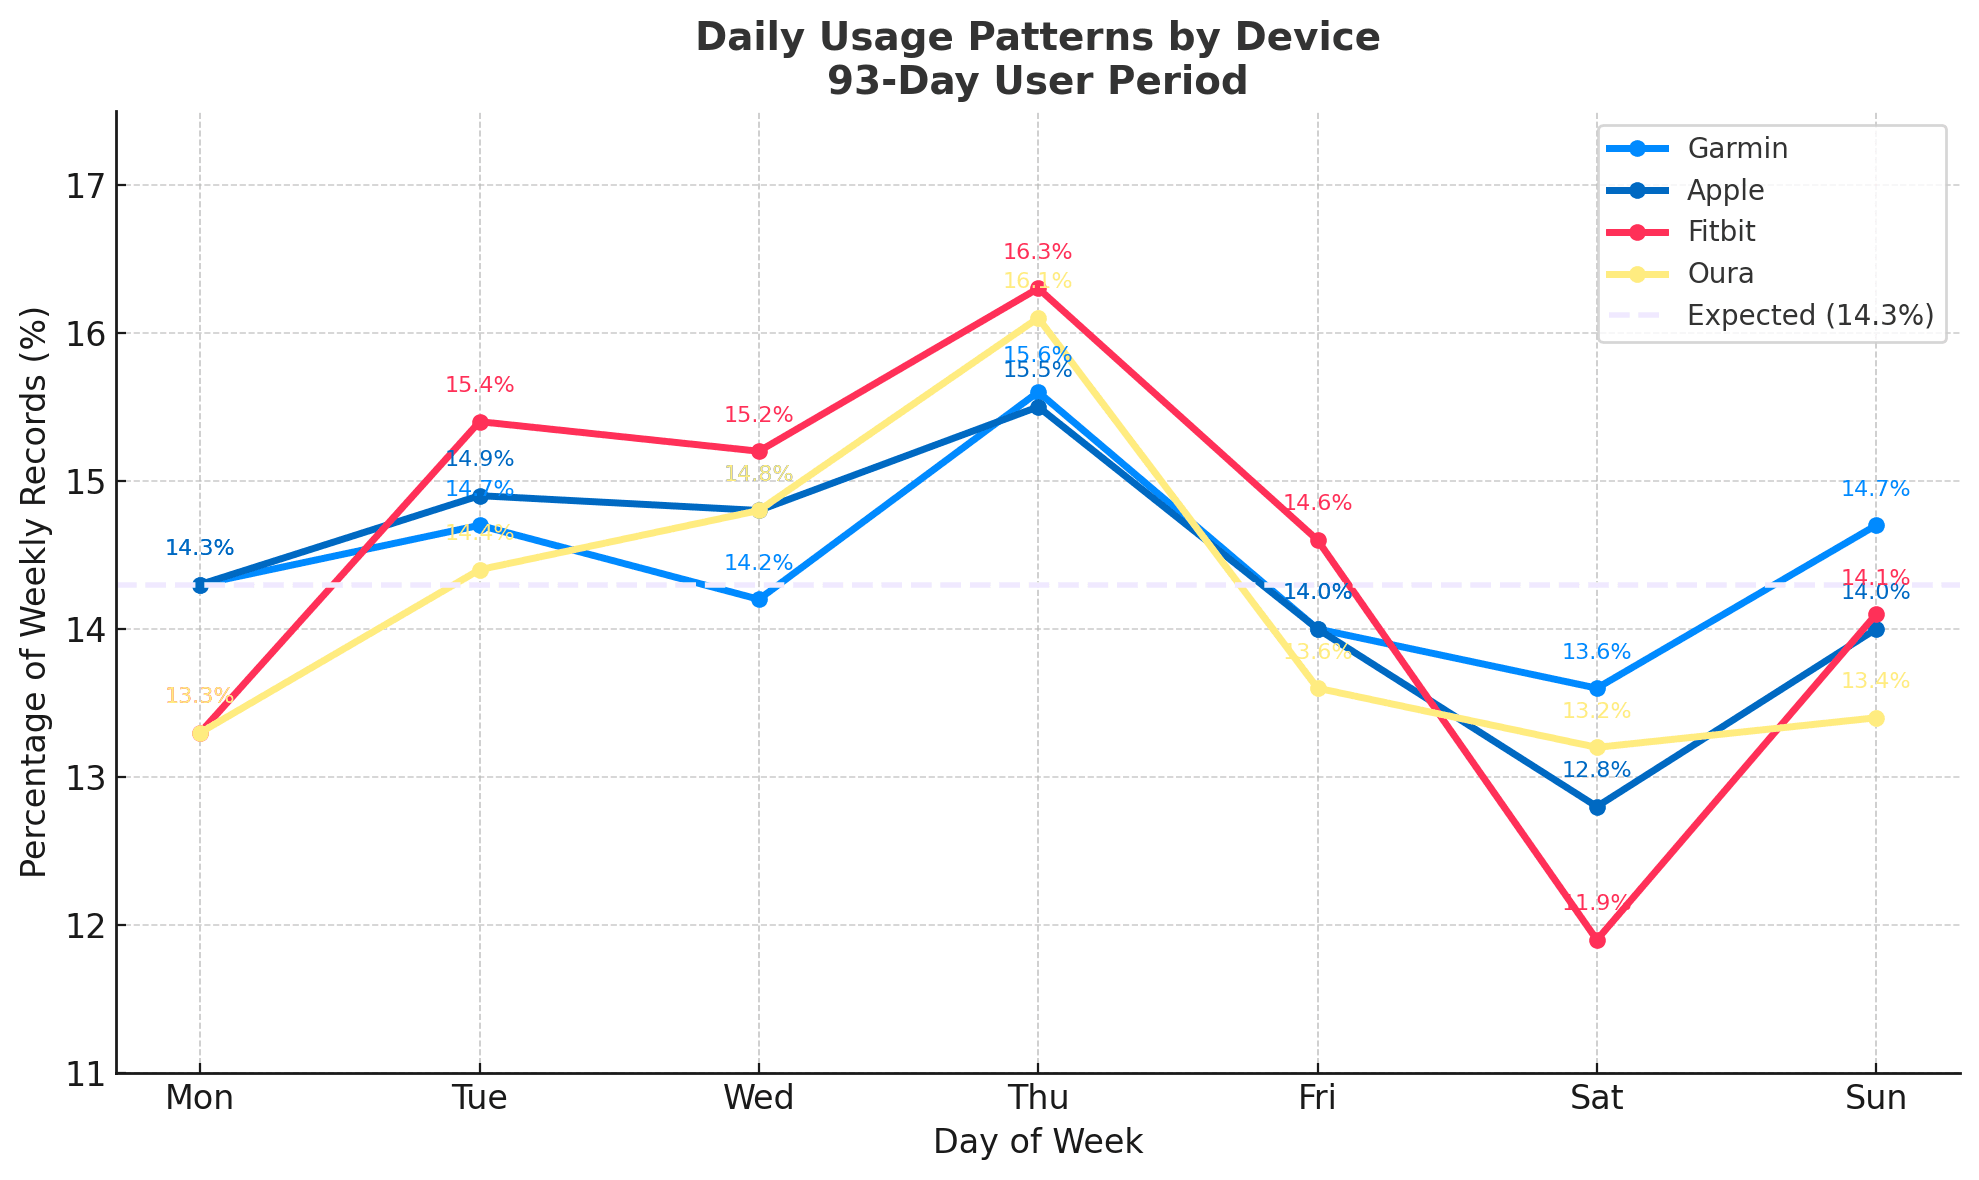
It’s not just about how often users log sleep, but also which nights they choose to wear (or not wear) their device. Across all platforms, Thursday shows the highest usage, while Saturday is consistently the lowest. Fitbit users exhibit the greatest fluctuation, whereas Garmin users remain comparatively steady throughout the week. These differences are statistically significant but small, so I don’t think they will have much impact on research. I actually found it surprising how similar the usage profiles are across the four wearables — and it’s a little amusing (though not especially important) that Fitbit users clearly stand out on the chart below for choosing Saturday as their “wearable night off”!
Figure 2: Daily rhythms of wearable sleep tracking across the week.
How Wearable Compliance Stacks Up in Clinical Studies
Compliance is a constant challenge for any researcher asking participants in a study to use wearables. Perhaps users who choose to adopt wearables in their own lives show better compliance, and we can learn lessons that help in a research setting. I looked into adherence data from the literature to understand how this compares to traditional clinical studies:
A scoping review examining wearable use in cancer patients, with a focus on sleep and activity, found adherence rates ranging from 60% to 100%, with the highest rates typically observed in 12-week studies.
Broader clinical applications of wearables show patient adherence typically between 70% and 80%, especially when integrated thoughtfully into trials.
Placed alongside our data, wearable sleep compliance rates meet or exceed those seen in structured clinical contexts. That’s noteworthy, given that compliance in clinical studies is often externally motivated. To me, it demonstrates the benefits of “in-the-wild” wearable research and the potential value in recruiting participants who are already avid users.
Why This Matters
Finally, the key insight is this: wearable devices support genuinely high sleep-tracking adherence, even under unmonitored, real-world conditions. A substantial share of users log data nearly every night. The device-specific weekly rhythms (such as Saturday dips) are interesting to recognize, and they might even influence the design and analysis of longitudinal sleep research.
Compared with structured clinical trials, real-world wearable usage rates are not only comparable but in some cases superior. In other words, these devices are not just accurate tools — they are also reliably used. That combination is what makes them powerful for real-world sleep and recovery research.
Summary questions
How often do people actually wear their devices to bed?
Very often. Across four wearables tracked over 93 days (1 May to 1 August 2025), a substantial share of users logged sleep data nearly every night between their first and last day of device use. Real-world overnight compliance is high enough that wearables can be treated as reliable longitudinal data sources, not occasional snapshots.
Which wearable has the best sleep-tracking compliance?
Fitbit and Oura users showed the highest and most consistent overnight compliance in this 93-day analysis. Apple Watch users were more bimodal — many high-compliance users, but also a sizeable low-compliance group. Garmin trailed with the lowest overall compliance across the four devices examined.
Which night of the week are people most likely to skip wearing their device?
Saturday, consistently. Across all four platforms, Thursday had the highest sleep-tracking usage and Saturday the lowest. Fitbit users showed the largest weekend dip, making Saturday their clear "night off," while Garmin users wore their devices most steadily throughout the week.
Do these weekly usage patterns actually affect sleep research?
Probably not much. While the Thursday-high, Saturday-low pattern is statistically significant across devices, the absolute differences are small. Researchers should be aware of weekend dips when designing longitudinal studies, but it's unlikely to materially bias most sleep or recovery analyses.
How does real-world wearable compliance compare to clinical studies?
It matches or beats it. Clinical wearable studies typically report 70–80% adherence, and a scoping review of cancer patient studies found a range of 60–100%, with the best rates in 12-week trials. Real-world users in this analysis hit comparable or superior compliance — without any external motivation or study protocol pushing them.
Should I recruit existing wearable users for my study instead of issuing new devices?
The data strongly supports it. People who already use wearables in daily life show compliance that meets or exceeds rates seen in structured clinical contexts where participants are externally motivated. Recruiting avid users likely yields more complete longitudinal datasets than handing out devices to naive participants.
Can I rely on wearable sleep data for longitudinal research?
Yes. The combination of high overnight logging rates and consistent week-to-week patterns means wearables produce dense, reliable sleep datasets in unmonitored conditions. For sleep and recovery research, these devices are not just accurate — they're worn often enough to support meaningful trend analysis.
Does it matter which wearable I recommend if I'm building a recovery or sleep app?
It can. If your product depends on daily sleep data, steering users toward higher-compliance devices like Fitbit or Oura will yield more consistent inputs than devices with bimodal or lower adherence patterns. Device choice directly shapes how much usable overnight data your product receives.