We use cookies to enhance your browsing experience and analyse our traffic. By clicking “Accept All”, you consent to our use of cookies according to our Cookie Policy. You can change your mind any time by visiting out cookie policy.
This week's research blog dives into a data-driven model that unlocks marathon potential by explaining 79% of finish time variance using six months of training data from hundreds of runners. Rejecting oversimplified training myths, it reveals non-linear dynamics: easy running delivers accelerating gains as its share increases, volume hits diminishing returns at higher levels, and fast work boosts performance below ~20% but backfires beyond. With inputs like baseline pace, total volume, intensity splits, and frequency, the model (R² = 0.793, RMSE ~18 min) highlights personalized interactions and that faster runners benefit more from volume and easy miles. Central to the post is an interactive marathon race pace calculator, letting readers plug in their data for ~79% accurate predictions, experiment with tweaks, and optimize training smarter.
We built a marathon training model that explains 79.3% of the variance in finish times — Baseline pace alone accounts for over half the predictive power. With an average error of ±18 minutes, we don’t think it should change the way you train, but it might be a useful starting point!
Consistent with previous findings: more easy running beats more hard running. — Runners spending 75–85% of their volume in zone 1 saw outsized improvements. Fast efforts help below ~20% of total time, but beyond that, they actually hurt. The "no pain, no gain" mantra doesn't hold up.
Training effects aren't universal — Faster runners extract more benefit from both volume and easy miles than slower runners do. One-size-fits-all plans don't work, and the data shows why. We built an interactive calculator so you can plug in your own numbers and see for yourself. Have a go!
Marathon Time Predictor
Adjust your training parameters to estimate your marathon finish time
5:30min/km
Base running pace
3:3010:00
15km/week
Average weekly training distance
5120
4runs
Average weekly training sessions
114
3runs
Easy/aerobic runs per week
04
1runs
Fast/threshold runs per week
04
Predicted Marathon Time
3:19
4:42 /km average pace
At Terra Research, part of our job is building products that turn data into useful information to help people live healthier lives. A model that could help people understand the training they need to complete to achieve that marathon PB, or the exact amount needed to run it in 4 hours with a friend, family member, or clubmate, would be a fantastic achievement!
At a simple level, I saw my athletic ability as composed of two elements. Firstly, my “baseline ability" as made up of my genetic propensity to do that activity. Secondly, my ability to adapt to a training stimulus. Think of this as the increase in fitness you get for every minute of training. My anecdotal experience was that I was quite poor, relatively speaking, on the first element, but seemed to relatively excel at the second.
Building on the research we’ve done over the last few weeks, we've built a predictive model using data from 101 marathon runners that explains 79.3% of the variance in finish times (R² = 0.7933). The average prediction error is 18.32 minutes. Think of variance here as the differences (the scatter) in finish times, 79% of those differences can be linked to the training and “ability” (baseline pace) information we put into the model. The remaining 21% is what we couldn’t explain: things like bad weather on race day, getting sick the week before, poor sleep, genetics we didn’t measure, motivation on the day, course surprises, tiny nutritional differences, luck, and many other factors we don’t know. Basically, everything else that affects the result but isn’t captured in our training data.
Spoiler, we have learnt that modeling human performance is hard. There are many interesting reasons for this, so let's dive in.
How The Model Works: Complexities of Training Variables
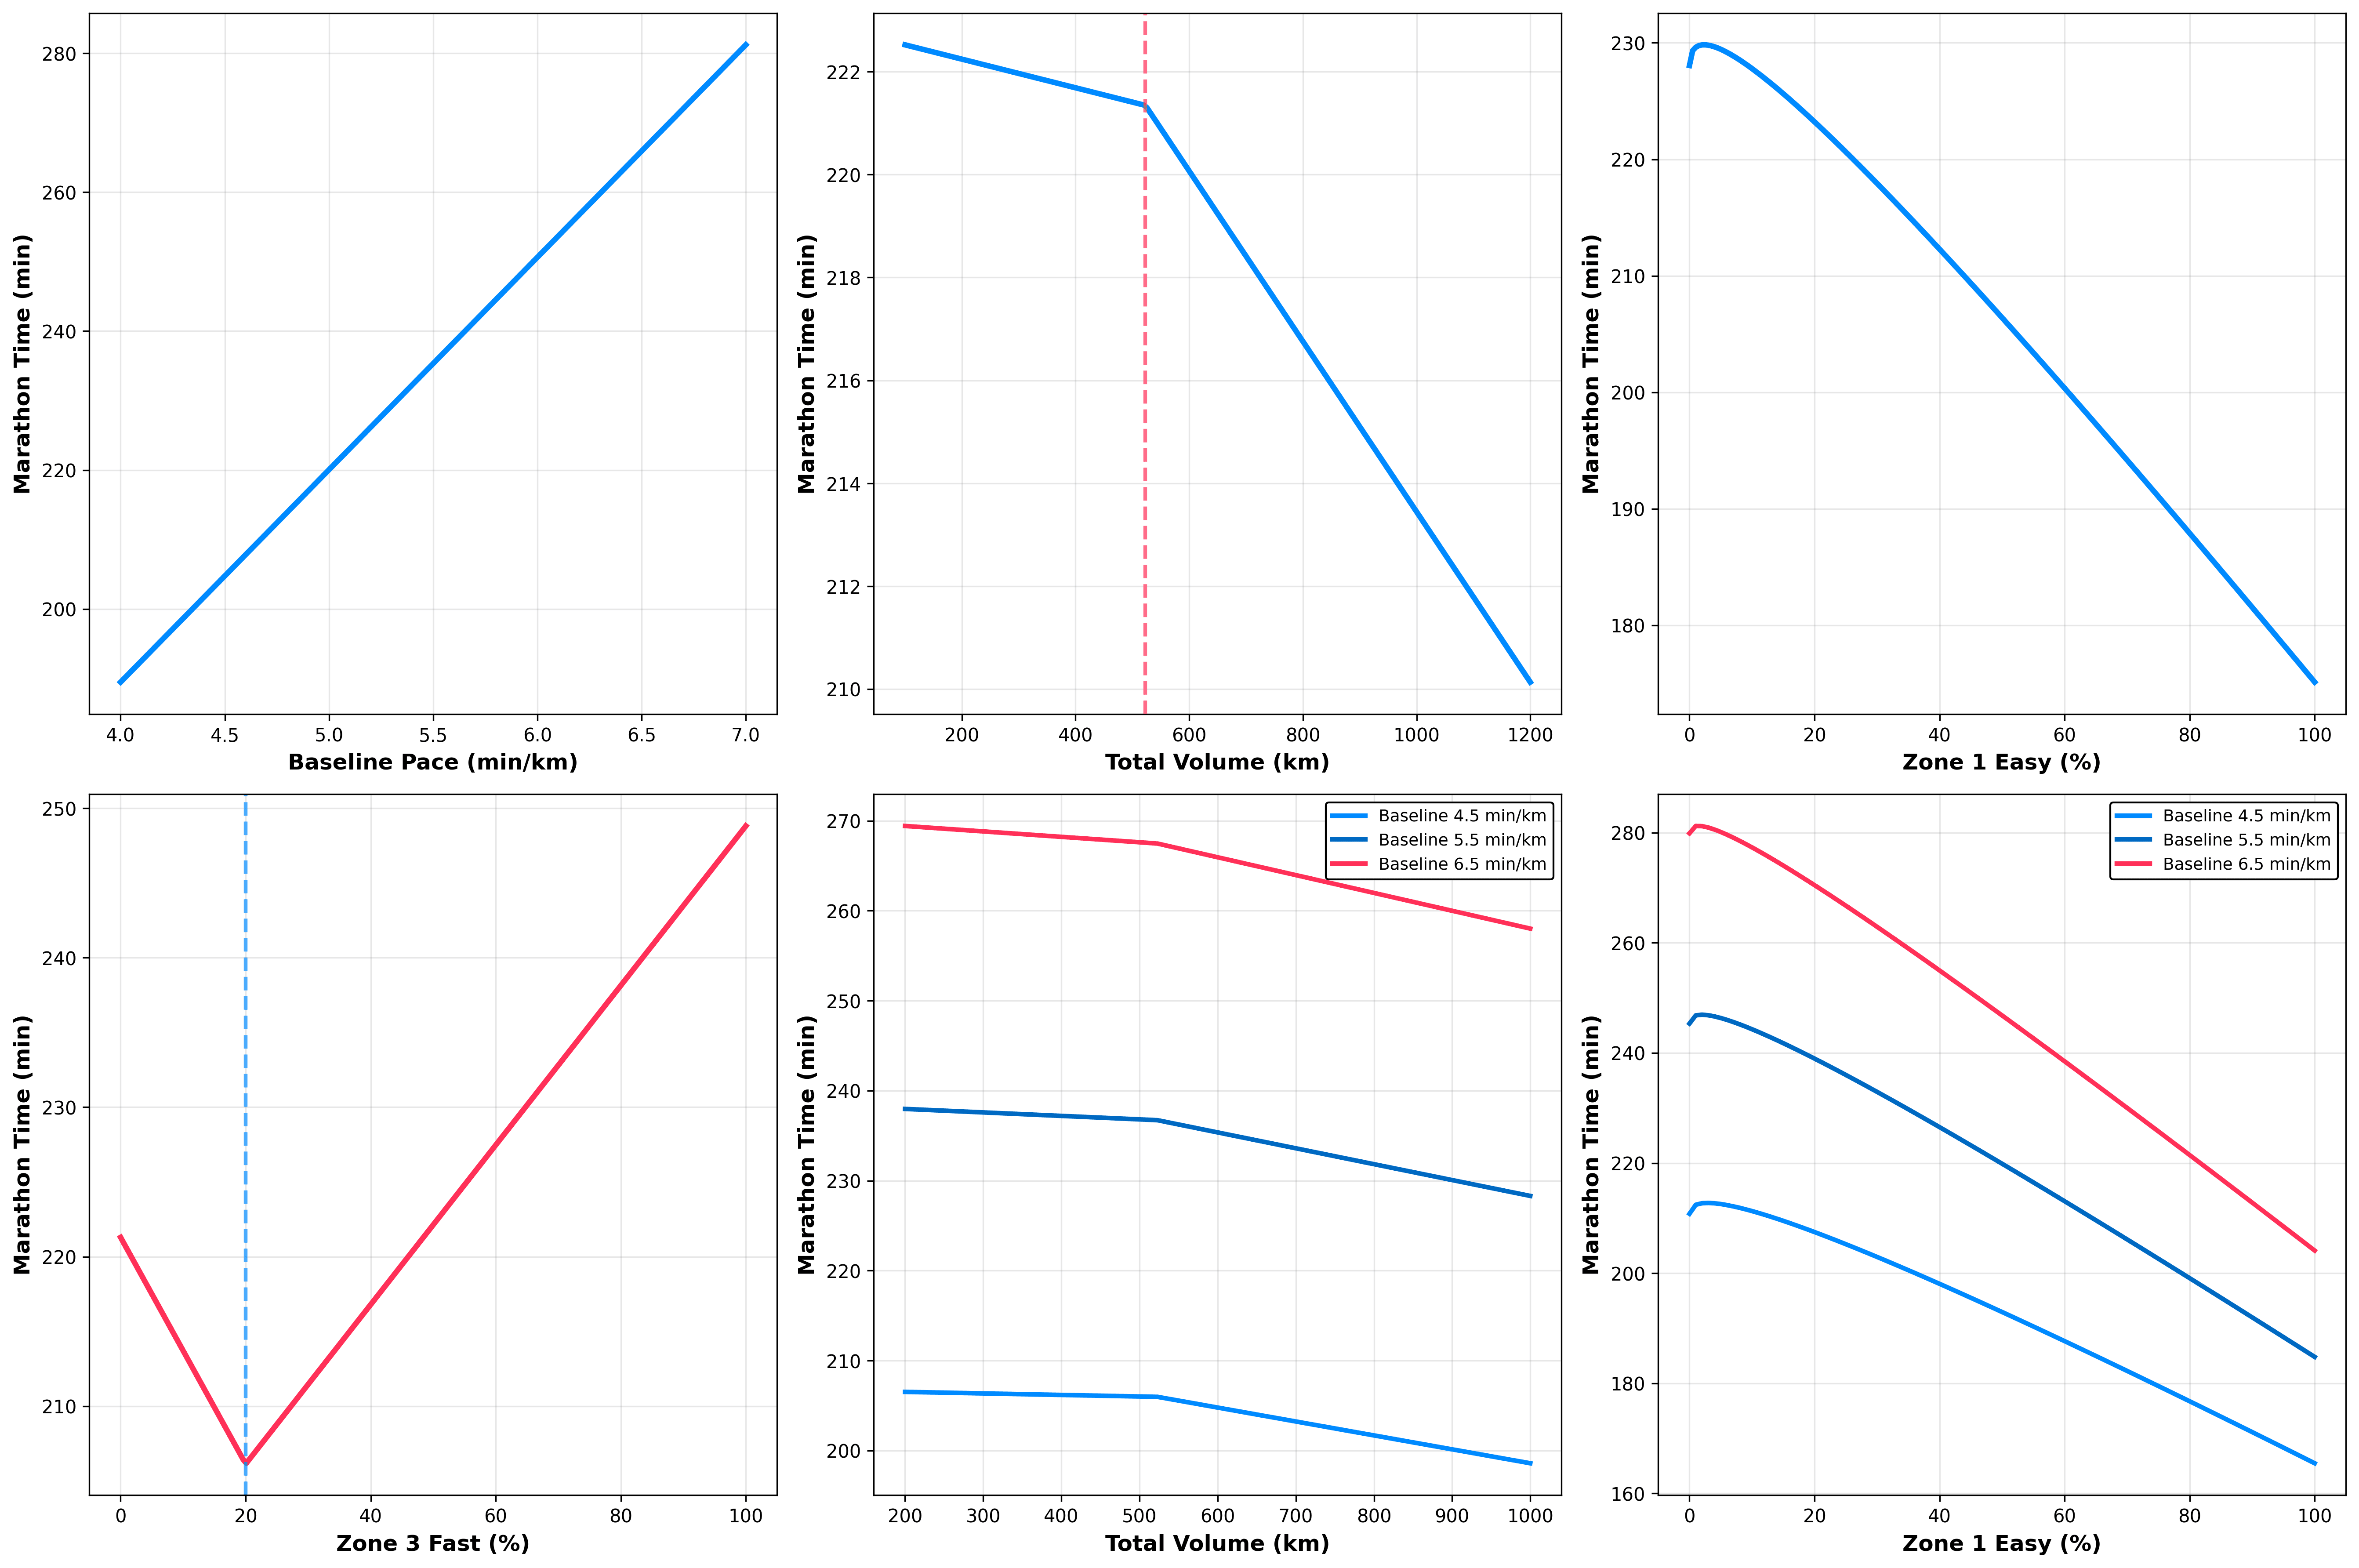
Figure 1: These figures show how individual training parameters (baseline pace, volume, and intensity zones) predict marathon time, with other variables held constant at their mean values. The bottom row demonstrates that training effects vary by baseline ability—faster runners benefit more from both volume and easy training than slower runners, highlighting the importance of personalised training approaches.
Our model predicts marathon finish time using five core inputs:
Baseline running pace (a proxy for ability).
Total training volume over six months.
Intensity distribution (percentage in easy, moderate, and fast zones).
Training frequency.
We incorporated non-linear terms and interactions: volume exhibits diminishing returns, easy training shows accelerating benefits, and effects scale with baseline fitness. Starting with a faster baseline remains the most heavily weighted factor.
This approach aligns with efforts to model performance from training data. For instance, machine learning has been used to personalize predictions by incorporating experience, volume, and intensity distributions (polarised vs pyramidal), often identifying individual responders and achieving strong predictive accuracy [1].
Get the latest Terra Research reports and insights every week as soon as they're published.
While our marathon training model has an R² of 0.7933, explaining 79.3% of the variance in finish times across 101 runners, with an average prediction error (RMSE) of 18.32 minutes, meaning predictions are typically within ±18 minutes two-thirds of the time, which isn’t much use to me. Most of us could probably predict our own and our friends' marathon times more precisely than that without a fancy model!
Where Our Data Falls Short
Internal Errors (Threats to Internal Validity)
These concern whether the model truly captures the cause-and-effect relationships between training inputs (like volume, intensity distribution, baseline pace, and frequency) and marathon performance, or if flaws in the data or setup distort the picture.
Incomplete or missing training records: One of the biggest internal issues is that we don't know if runners recorded all their sessions on GPS devices or apps. Many people forget to start/stop tracking, skip logging easy/recovery runs (deeming them "unimportant"), pause watches during breaks, or omit cross-training/strength work. This creates systematic underestimation of true training load for some runners, meaning the "volume" and "intensity distribution" fed into the model represent only digitally captured data, not the full physiological stimulus.
GPS measurement inaccuracies and noise: GPS watches/tracking apps may have systematic errors in distance, pace, and elevation, typically overestimating distance by 1–6% (especially on curvy routes, trails, or under tree cover/urban canyons due to signal multipath or interpolation issues), or underestimating in obstructed environments. This adds random, biased noise to inputs such as total volume or intensity zones, weakening internal causal links. I think in the context of this study, this is a small error but worth noting. It’s also worth noting that we intentionally did not use device-reported Heart Rate Zones due to differences in calculation methods between devices and reporting inaccuracies (often due to self-entered Max HR).
Use of baseline pace: The use of baseline pace is suboptimal. Here, we compute the average pace across all runs the user completes in the first 30 days. If a user has only done a couple of very fast or very slow runs, it disrupts the model.
Correlational design and unmeasured confounders within the training data: The model is purely observational/correlational, so it spots patterns in what successful runners did but can't prove that changing training causes the predicted improvements. Individual variability (e.g., genetics, stress, sleep fluctuations) and non-response rates (20–50% in endurance interventions) mean some runners adapt differently to the same inputs, introducing internal confounding not captured by our five variables. Ultimately, while it quantifies probabilistic trends with nonlinear interactions and diminishing returns (e.g., volume benefits taper off at higher levels), performance modelling remains challenging due to the sport's multifactorial complexity, which can lead to overfitting or extrapolation errors in unseen scenarios.
The Limits of Generalizing From 101 Runners
External Errors (Threats to External Validity/Generalisability)
These question how well the model's findings apply beyond our specific sample to other runners, contexts, or real races.
Limited sample representativeness: With only 101 runners (mostly recreational/sub-elite, with consistent 6-month data), the model may not generalise to beginners, true elites, older/younger athletes, different genders, injury-prone groups, or diverse demographics/backgrounds. We don’t know anything about the users, so the sample could be all 40-year-old females for all we know. Training effects (e.g., easy-run benefits accelerating more for faster baselines) could differ markedly in unseen populations.
Omission of race-day and real-world factors: The model ignores external confounders such as weather, course elevation/terrain, nutrition/hydration failures, taper quality, psychological state, pacing errors, or motivation. Variables that cause 5–10+ minute swings even for elites. Predictions reflect training capability in ideal conditions, not actual race outcomes in variable environments. Ultimately, there are many confounders that we may never be able to guess!
Assumption of steady, long-cycle training: It presumes consistent 6-month periods; shorter prep, inconsistent habits, or disrupted training (e.g., illness/injury) produce different dynamics, reducing applicability to varied real-world scenarios. This is a major limitation of the model and severely limits its applicability in the real world.
Similar predictive accuracy is observed in studies using regression or AI on race and training data, where models explain substantial variance (often R² > 0.7–0.9) but highlight the limits of individual factors [2,3]. For comparison, some marathon prediction models based on half-marathon times and pacing achieve R² values of 0.88–0.95 and errors of 4–8 minutes in certain groups [2].
Trying Other Modeling Techniques
Retrospectively, more successful runners have spent more time in zone 1 at a slower pace than during their marathon. However, this zone 1 definition is highly variable across users because it depends on their marathon time; it's not a metric we can count on for predictive modelling.
If we want to predict a future race time, we should base it only on the training details we have! For this reason, we built and tested different machine learning models to do this. The input into these models was their baseline pace, defined as the average running pace in their first 20 days of training, total training volume, and training consistency, defined as the mean number of runs per week and mean heart rate reserve. Across regularised linear models, tree-based models and boosting algorithms, the optimal performance we achieved was R² = 0.68 and RMSE = 31.33 minutes, a 62% improvement in explained variance compared to the model without baseline pace.
We found something really interesting: baseline pace is the strongest predictor, accounting for over 50% of the predictive power. These models have seen a consistent pattern: faster people have lower marathon times!
With a more extensive dataset, with people who push themselves hard and improve exponentially with training, the models would be more robust in predicting a runner’s capacity without relying solely on where they’re starting.
What the Data Actually Tells Us
Easy Training Accelerates Gains
Each additional percentage of easy miles yields increasing benefits. Runners emphasising easy zones (often 75–85% of volume) saw outsized improvements. This mirrors findings that world-class performances correlate most strongly with high-volume easy runs, which build aerobic base, capillary density, and recovery without excessive fatigue [4]. Large-scale analyses of marathon runners show strong negative correlations between easy-zone proportion and finish times, with pyramidal distributions (high, moderate, medium, low, high intensity) dominant among faster groups [5].
High-Intensity Training: Beneficial in Moderation
Fast efforts help below ~20% of the total time but seem become detrimental beyond that threshold. Small doses boost VO₂ max and speed; larger doses may have a negative effect. Polarised approaches (high-intensity + targeted high-intensity) often outperform threshold-based plans in some contexts, though pyramidal training suits many marathoners [6].
Volume: Diminishing Returns Set In
Adding kilometres helps more at lower totals (e.g., from 300 km/month) than at high levels. Faster runners benefit disproportionately from volume increases. Observational data show that faster marathoners accumulate 2–3× more weekly distance, mostly via easy miles, with gains plateauing beyond moderate-to-high ranges for recreational runners [5,6].
Personalisation Matters Most
Training effects vary dramatically by baseline ability—faster runners seem to extract more from volume and easy work. Individual responses vary due to genetics, experience, and history; one-size-fits-all approaches often fail. Machine learning has clustered runners into polarised (responders) and pyramidal types based on traits such as experience, underscoring the need for tailored plans [1].
Is it possible to model performance?
We hope so!
We’re publishing this interactive version anyway because we think it’s valuable for runners and coaches to play around with, plug in your own numbers, tweak the sliders, see what it spits out, and use it as a conversation starter for your training rather than gospel. Treat it like a rough prototype: insightful, directional, and often wrong. Far more sophisticated versions, with bigger datasets, better handling of missing data, richer personalization, and integration of race-day factors, are already in the works and will follow. For now, have fun experimenting, but keep expectations realistic and your own experience front and centre. Happy tinkering!
References
Lerebourg L, et al. (2025). Machine learning-based personalized training models for optimizing marathon performance through pyramidal and polarized training intensity distributions. Scientific Reports. https://www.nature.com/articles/s41598-025-25369-7
Casado A, et al. (2021). World-Class Long-Distance Running Performances Are Best Predicted by Volume of Easy Runs and Deliberate Practice of Short-Interval and Tempo Runs. Journal of Strength and Conditioning Research. https://pubmed.ncbi.nlm.nih.gov/31045681/
Filipas L, et al. (2022). Effects of 16 weeks of pyramidal and polarized training intensity distributions in well‐trained endurance runners. Scandinavian Journal of Sports Science and Medicine.https://pmc.ncbi.nlm.nih.gov/articles/PMC9299127/
Summary questions
Can wearable data actually predict my marathon finish time?
Partially. A model built from 101 marathon runners explained 79.3% of the variance in finish times (R² = 0.7933), but the average prediction error was ±18.32 minutes — meaning two-thirds of predictions land within an 18-minute window. That's directionally useful but not precise enough to plan a goal pace around, and most runners could probably guess their own time more accurately than that.
What's the single biggest predictor of marathon time?
Baseline pace — how fast you already are. Across regularised linear, tree-based, and boosting models, baseline pace accounted for over 50% of the predictive power, and adding it produced a 62% improvement in explained variance versus models without it. The uncomfortable truth from the data: where you're starting matters more than any single training variable.
How much of my training should be easy?
The data points to roughly 75–85% of total volume in easy zones, with each additional percentage of easy miles producing accelerating, not diminishing, benefits. Faster runners in particular extracted outsized improvements from easy-zone work, consistent with pyramidal distributions dominating among quicker marathoners. If you're going to bias your training one way, bias it slow.
Does more high-intensity work make me faster?
Only up to a point. Fast efforts appear beneficial below roughly 20% of total training time but become detrimental beyond that threshold. Small doses boost VO₂ max and speed; piling on more intensity tends to backfire, which is why polarised and pyramidal models — not threshold-heavy plans — dominate among successful marathoners.
Why am I not getting faster despite running more kilometres?
Volume shows diminishing returns. Adding mileage helps far more when you're going from, say, 300 km/month upward than when you're already at high totals, and the benefit is disproportionately captured by faster runners. For recreational runners, gains plateau in the moderate-to-high range — meaning more kilometres alone won't keep moving the needle without the right intensity mix and consistency.
Why is modeling marathon performance so hard?
Because the inputs are messy and the outputs are multifactorial. Runners forget to log sessions, GPS overestimates distance by 1–6%, baseline pace can be skewed by a couple of unusually fast or slow runs in the first 30 days, and 20–50% of endurance athletes are non-responders to standard stimuli. On top of that, race-day factors like weather, pacing, nutrition, and taper quality can swing finish times by 5–10+ minutes even for elites — none of which a training-only model captures.
Do faster runners benefit more from training than slower runners?
Yes, and significantly. The model showed that training effects scale with baseline fitness — faster runners extract more from each additional kilometre of volume and each percentage point of easy training than slower runners do. This is why one-size-fits-all plans underperform: the same training stimulus produces meaningfully different adaptations depending on where you start.
Should I trust a marathon time predictor built on 101 runners?
Treat it as directional, not gospel. With only 101 mostly recreational runners and no demographic detail, the model may not generalise to beginners, elites, older athletes, or different training patterns, and it assumes a steady 6-month build with no illness or injury. Comparable published models using half-marathon times reach R² of 0.88–0.95 with 4–8 minute errors — so better tools exist, and this one is best used as a conversation starter for training, not a race-day commitment.