We use cookies to enhance your browsing experience and analyse our traffic. By clicking “Accept All”, you consent to our use of cookies according to our Cookie Policy. You can change your mind any time by visiting out cookie policy.
Every January, millions pledge to sleep more along with their New Year's Resolutions. But does it work? Analyzing more than 60,000 sleep trackers, our research team found a compelling pattern: a modest January sleep surge that quickly evaporates. 60% of January 2 starters failed within days, sleep latency worsened as people tried too hard, and gains averaged mere minutes—not hours. The data reveals why most resolutions fail and what actually works for sustainable sleep improvement.
60% quit New Year's Resolutions within 48 hours. Among new year's sleep resolutions, median streak lasted 1 day. 80.6% dropped off after 1-2 days. Fewer than 3% made it past 5 days.
Trying harder made sleep worse. January sleep latency spiked to 26+ minutes (vs. 23-24 later). People spent more time in bed but took longer to fall asleep—proof that forced schedules backfire.
Weekends saved the quarter. Saturdays peaked at 7.62 hours—14 minutes more than weekdays. Post-holiday catch-up only worked when people had actual recovery time.
When New Year's Resolutions Meet Reality
Every year, as the clock strikes midnight on December 31, millions of us around the world make the same quiet promise: this year, I'll sleep more. It's not as flashy as gym memberships or dry January, but improving sleep ranks among the top resolutions and is likely one of the most significant we can make to improve our health. Driven by holiday exhaustion, a desire for better health, and that fresh-start feeling only a new calendar can bring. In a sea of anecdotal "I tried and failed" stories, being Terra Research, we wanted hard evidence.
So we analysed Q1 2025 sleep-tracking data from 11,298 unique users, contributing 559,468 filtered main sleep nights (after excluding naps and extreme durations). The results tell a compelling, very human story: yes, there really is a New Year's sleep resolution effect. People try harder in January. But for most, the effort is short-lived, modest in scale, and quickly overtaken by old habits.
The data reveals a subtle but detectable January surge. Average total sleep time edged higher right at the start of the year, weekends became prime recovery opportunities, and tracker usage exploded from January 2 onward—classic signs of resolution fervour. Yet dig deeper, and the limitations emerge: longer time in bed often came with worse sleep latency (more tossing and turning), gains averaged mere minutes, and individual improvements typically lasted days, not weeks. By February, metrics normalised, as most of us returned to baseline!
This isn't just population noise; individual-level patterns reinforce the narrative. Many users kicked off genuine attempts on January 2 (that’s the sleep data from the night of January 1st), only to see momentum evaporate rapidly. The story isn't one of total failure, but of how hard sustainable change truly is, even for something as essential as sleep.
Get the latest Terra Research reports and insights every week as soon as they're published.
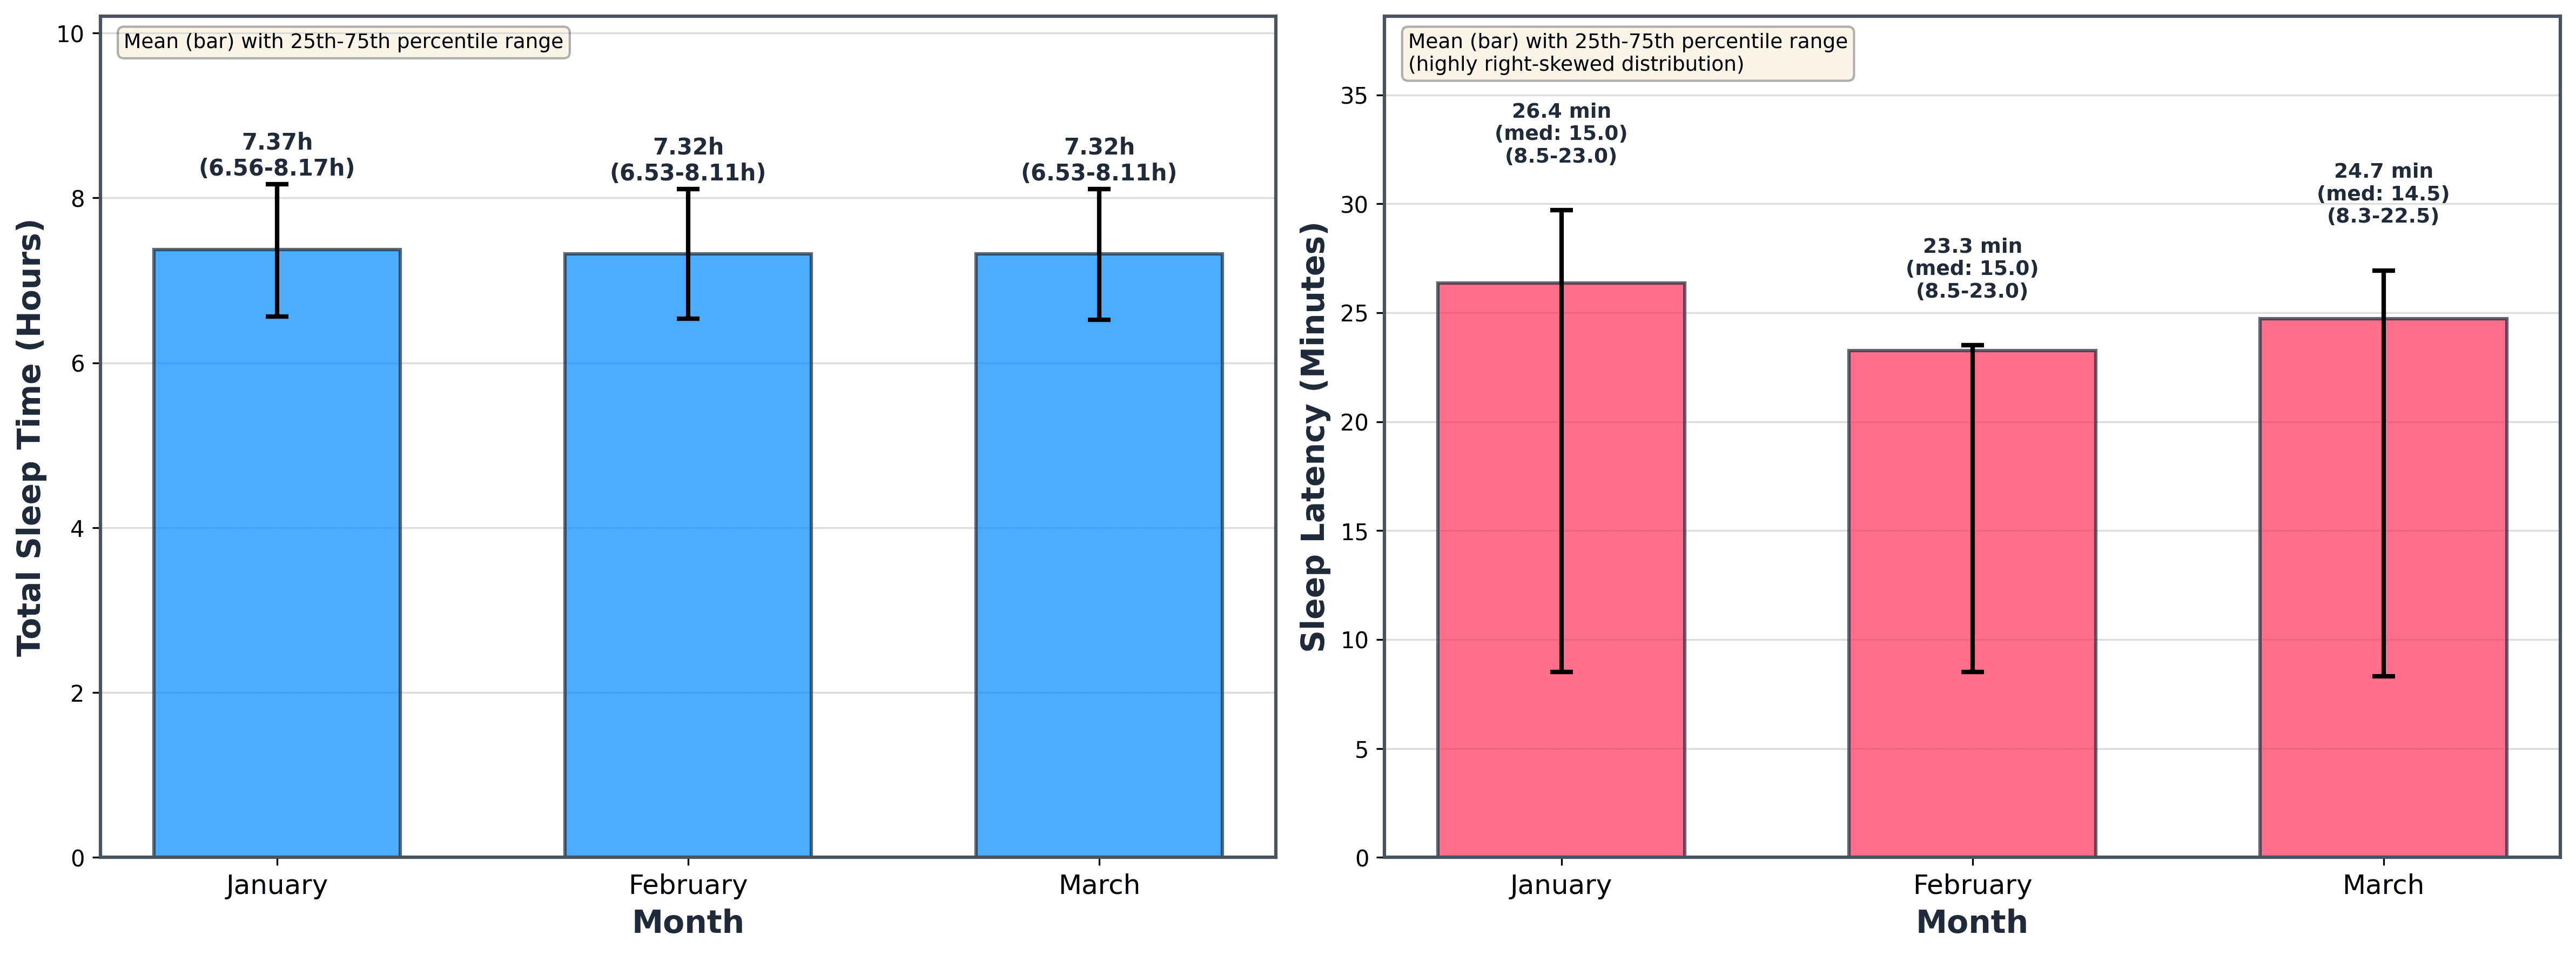
Figure 1: Monthly Total Sleep Time and Sleep Latency: The left panel displays average total sleep time per month with interquartile ranges, showing a small but consistent January peak. The right panel highlights sleep latency's skewed distribution, where January's higher mean contrasts with a more typical median, indicating many struggled to fall asleep despite extra time in bed. So even when we try to get more sleep, nature is against us!
January clocks in at around 7.37 hours of sleep on average, about 5 minutes more than the 7.32 hours seen in both February and March. That difference, while tiny in daily life, is highly statistically significant across thousands of users. It's the kind of bump you'd expect from widespread resolution attempts: people committing to earlier bedtimes or longer lie-ins after holiday disruptions. But the accompanying rise in sleep latency tells a cautionary tale.
Taking over 26 minutes on average to fall asleep (versus 23–24 minutes later) suggests forced schedule changes without proper wind-down routines. Many were in bed longer... but not sleeping better, annoying!
Individual-Level Significance of January 2 Periods
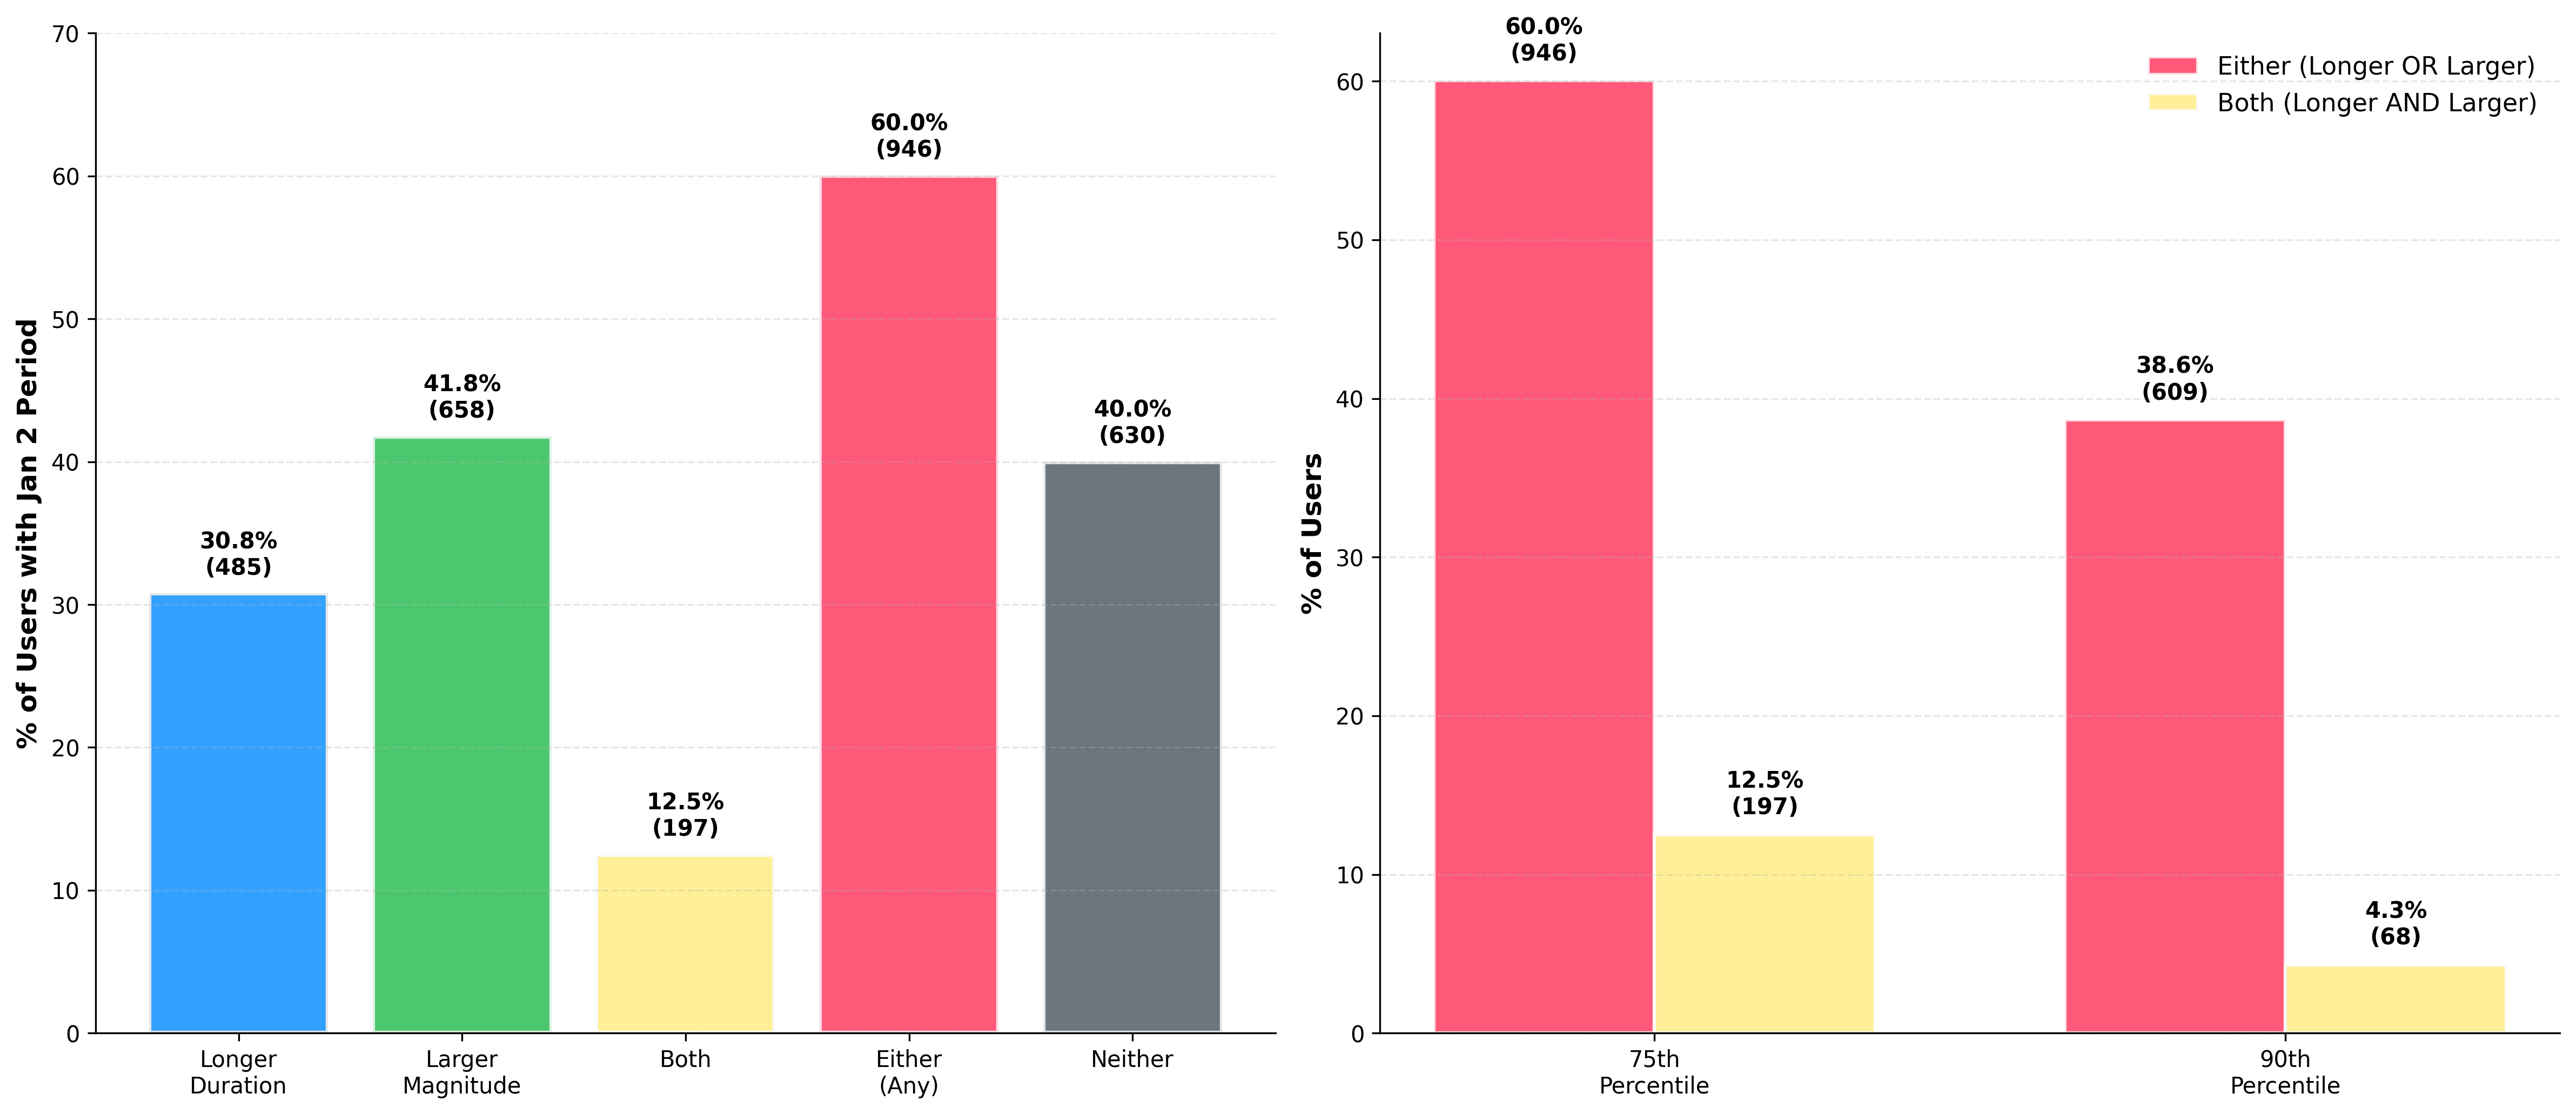
Figure 2: Individual-Level Significance of January 2 Periods: This two-panel breakdown compares each user's January 2 improvement period to their typical periods elsewhere in Q1, using 75th- (left) and 90th- (right) percentile thresholds. It reveals that 60% of users experienced a meaningfully standout January 2 effort—either longer-lasting, larger in magnitude, or both—providing strong individual-level evidence of resolution behaviour.
Focusing on users who started an above-baseline streak precisely on January 2 (the ultimate "fresh start" date), we find something remarkable: for 60%, that period was significantly different from their norm across the quarter. Some sustained it longer, others achieved bigger gains, and a dedicated subset did both.
This isn't an aggregate illusion; it's personal. These individuals genuinely deviated from their usual patterns right when cultural cues screamed "change now." Even under stricter criteria (90th percentile), nearly 40% still stood out. Magnitude drove more differences than duration, hinting that people often aimed for bigger leaps rather than steady consistency. Anecdotal assumption here; this is why most of us fail. Little consistent gains are the way to go!
Sleep Trajectory for January 2 Starters
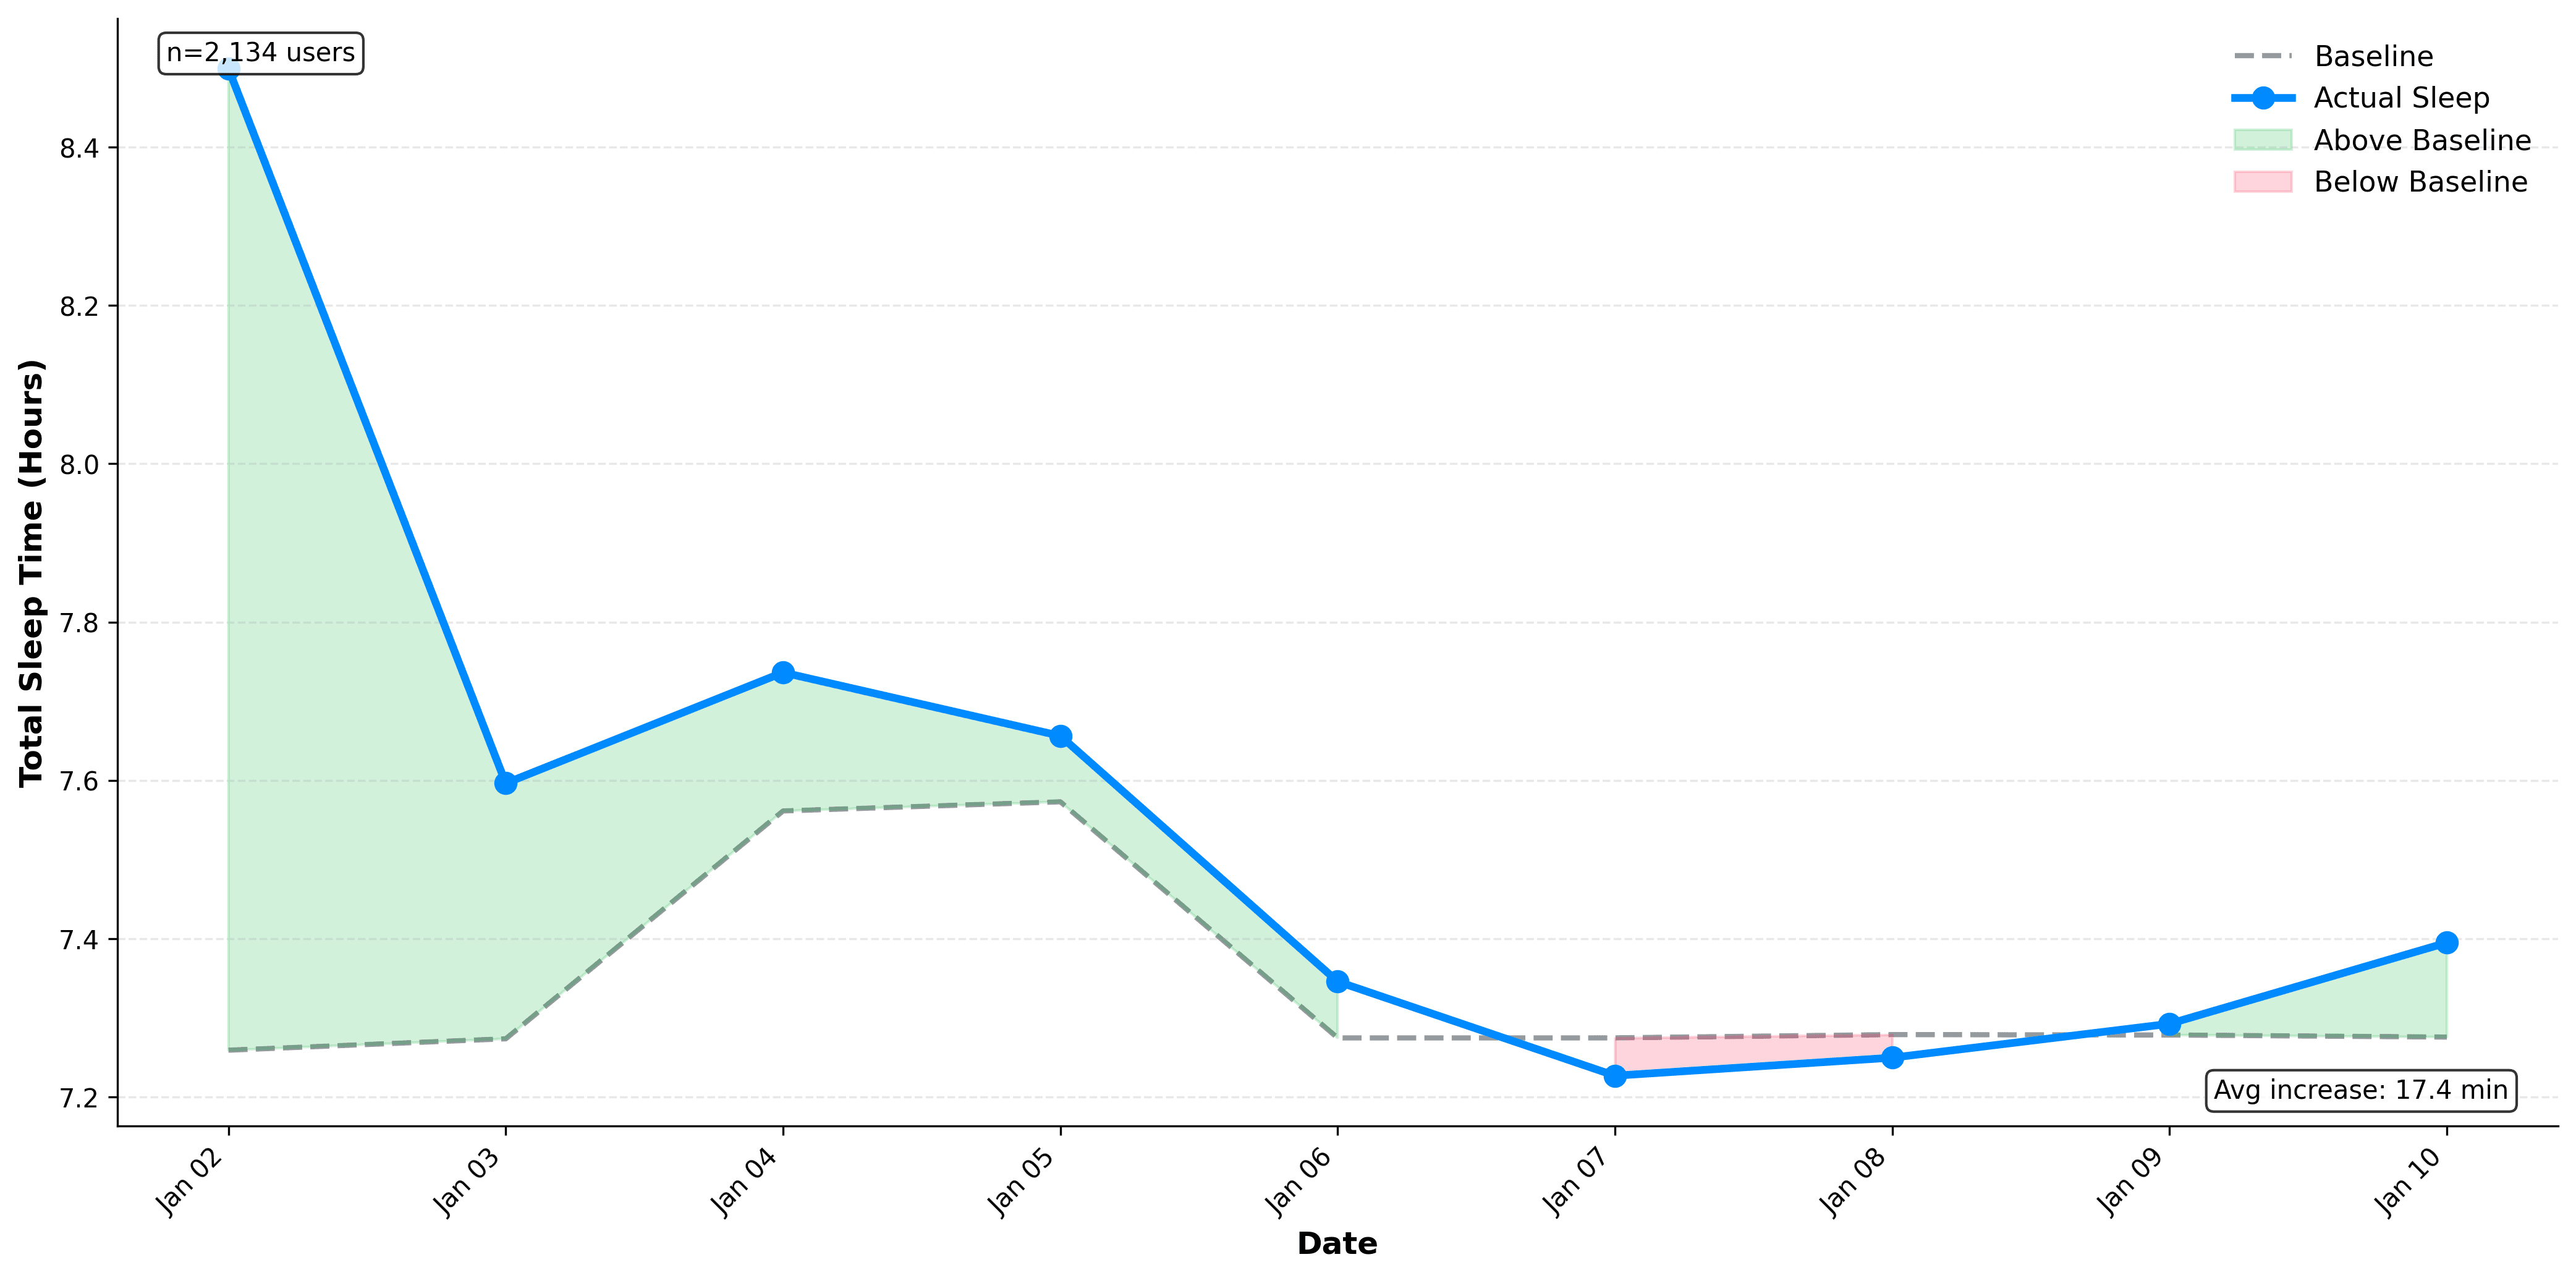
Figure 3: Sleep Trajectory for January 2 Starters: The blue line tracks average daily sleep for January 2 starters relative to their personal baselines (dashed grey), with shaded areas indicating gains or losses. It illustrates an enthusiastic early boost that steadily declines, returning to baseline within days and dipping slightly below it by late January.
Follow the user population day by day, and the arc is unmistakable. They launch well above their personalised weekday/weekend baselines. But the line trends downward almost immediately. Within a week or so, the average returns to normal; by late January, it hovers near or slightly under baseline. The shaded green "gain" area dominates early, then shrinks as red "loss" emerges. This trajectory mirrors countless resolution stories: high motivation out of the gate, gradual erosion as life intervenes.
Duration of January 2 Sleep Increases
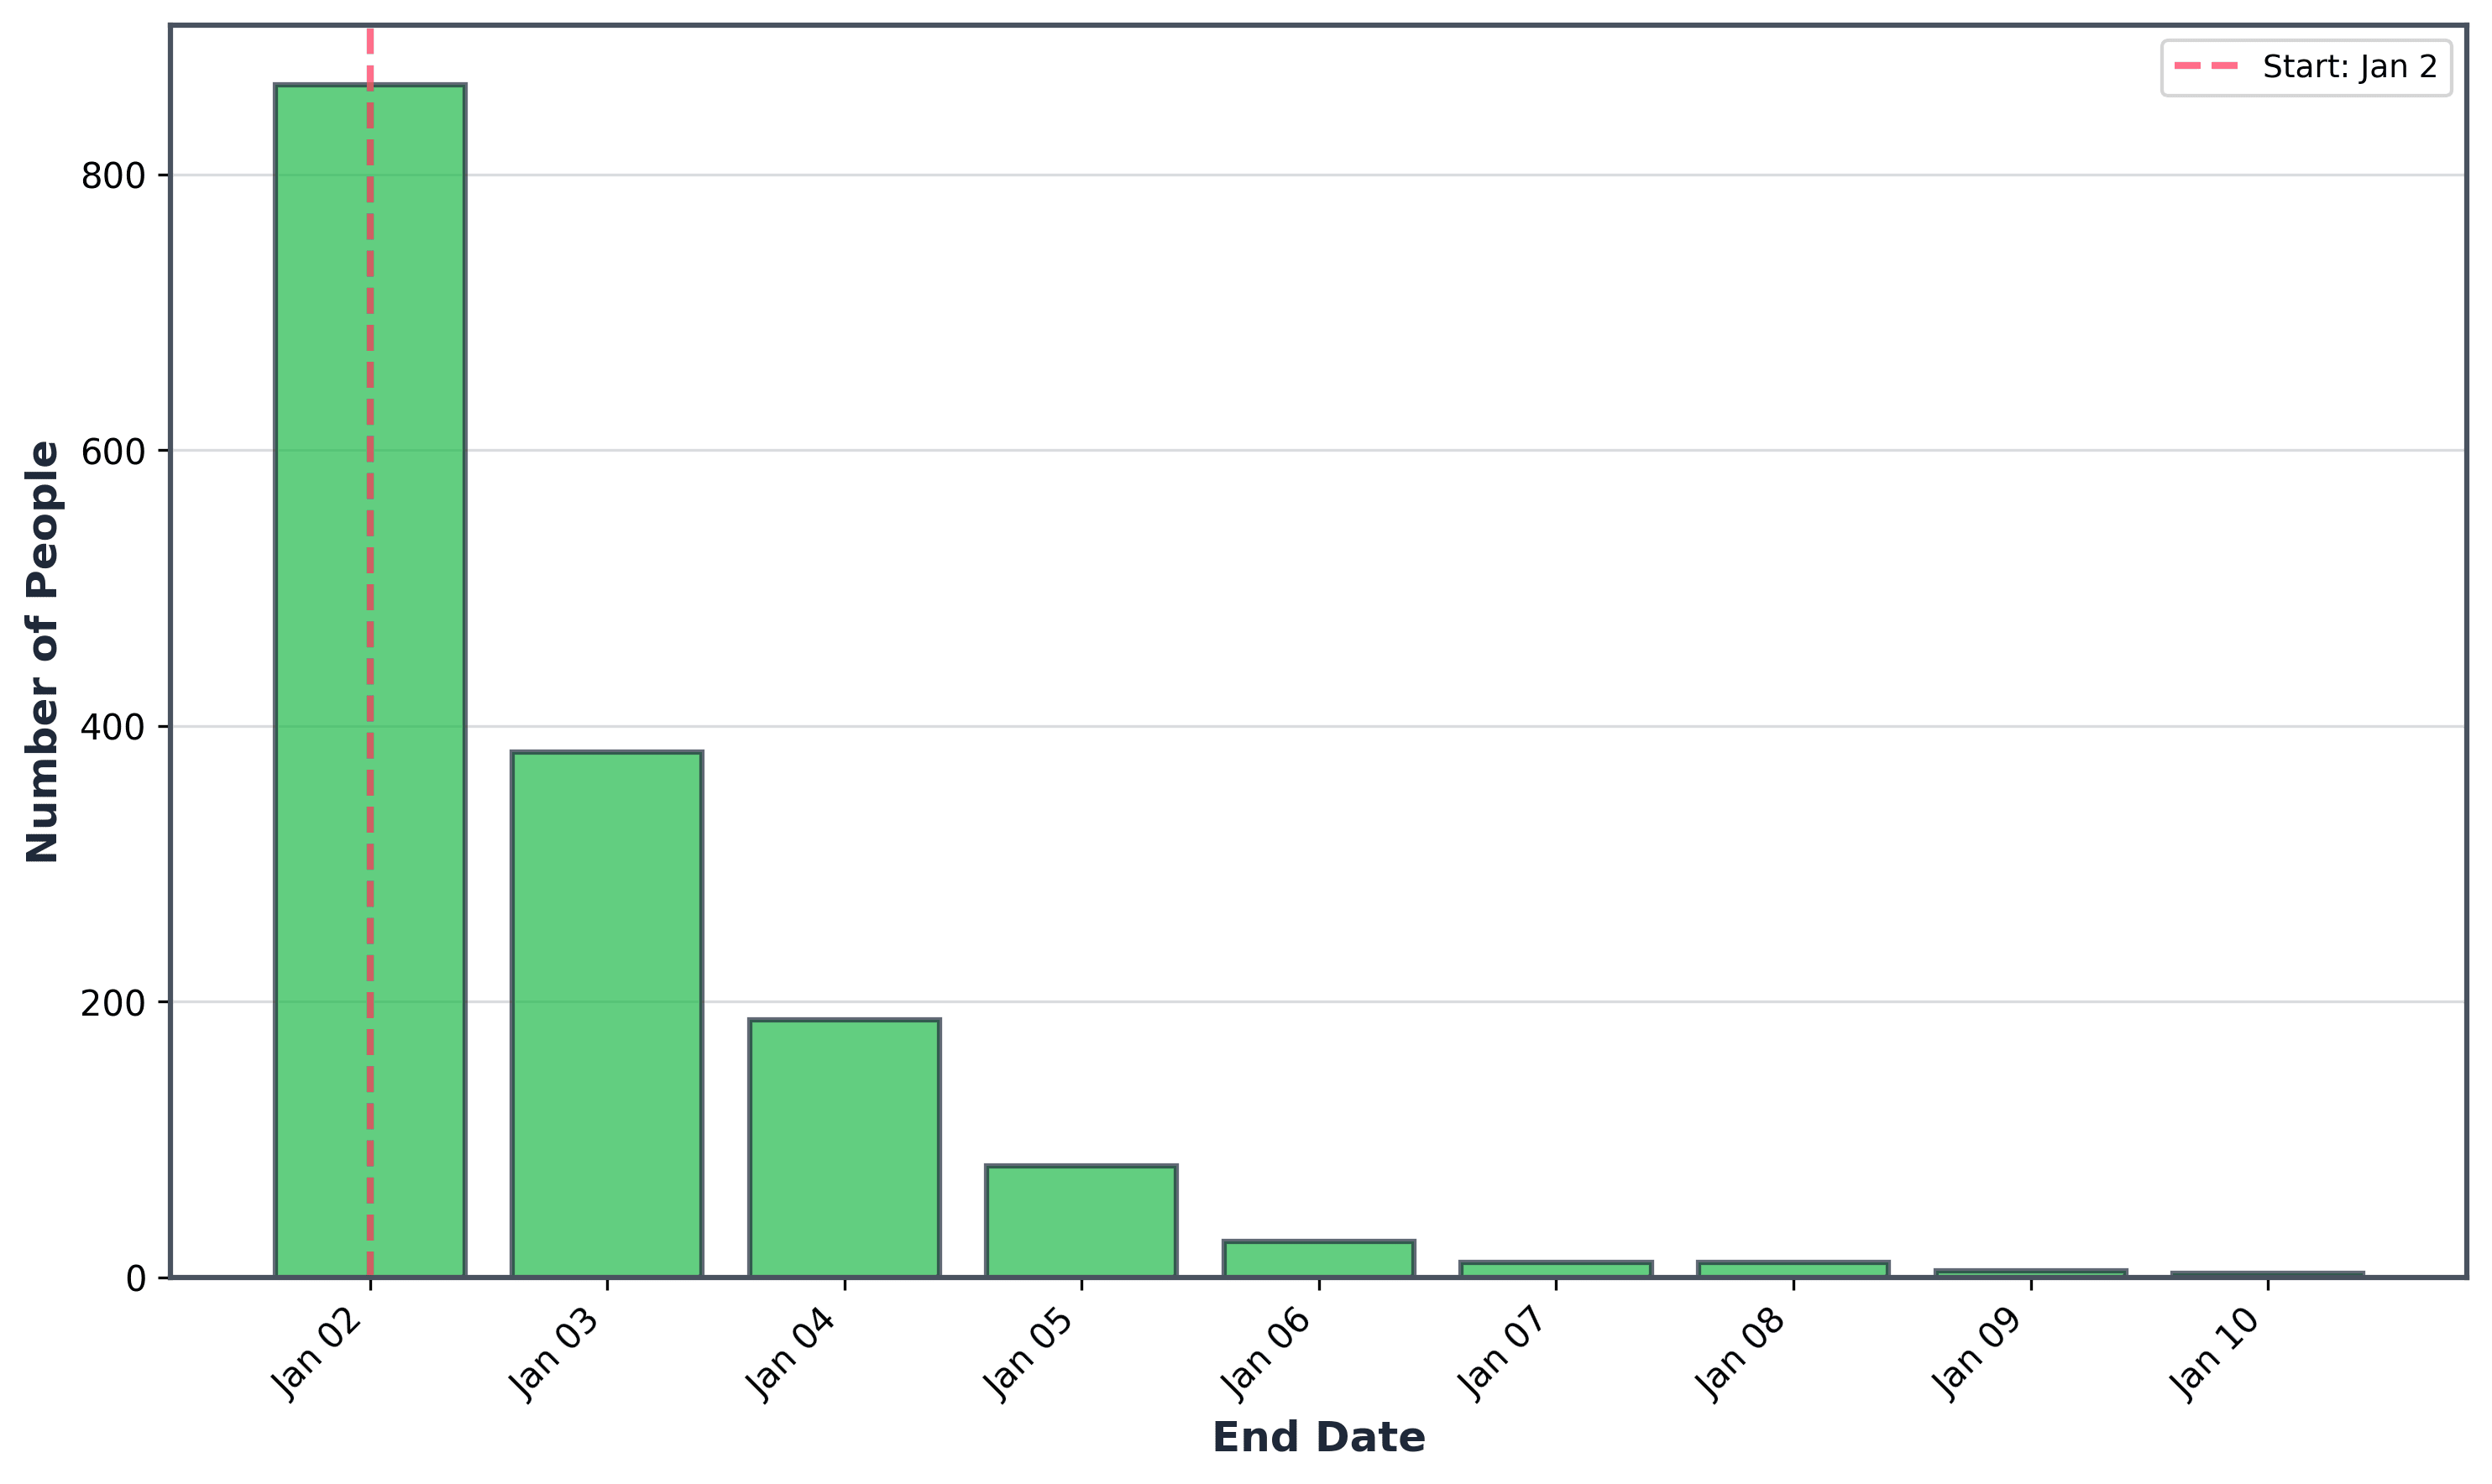
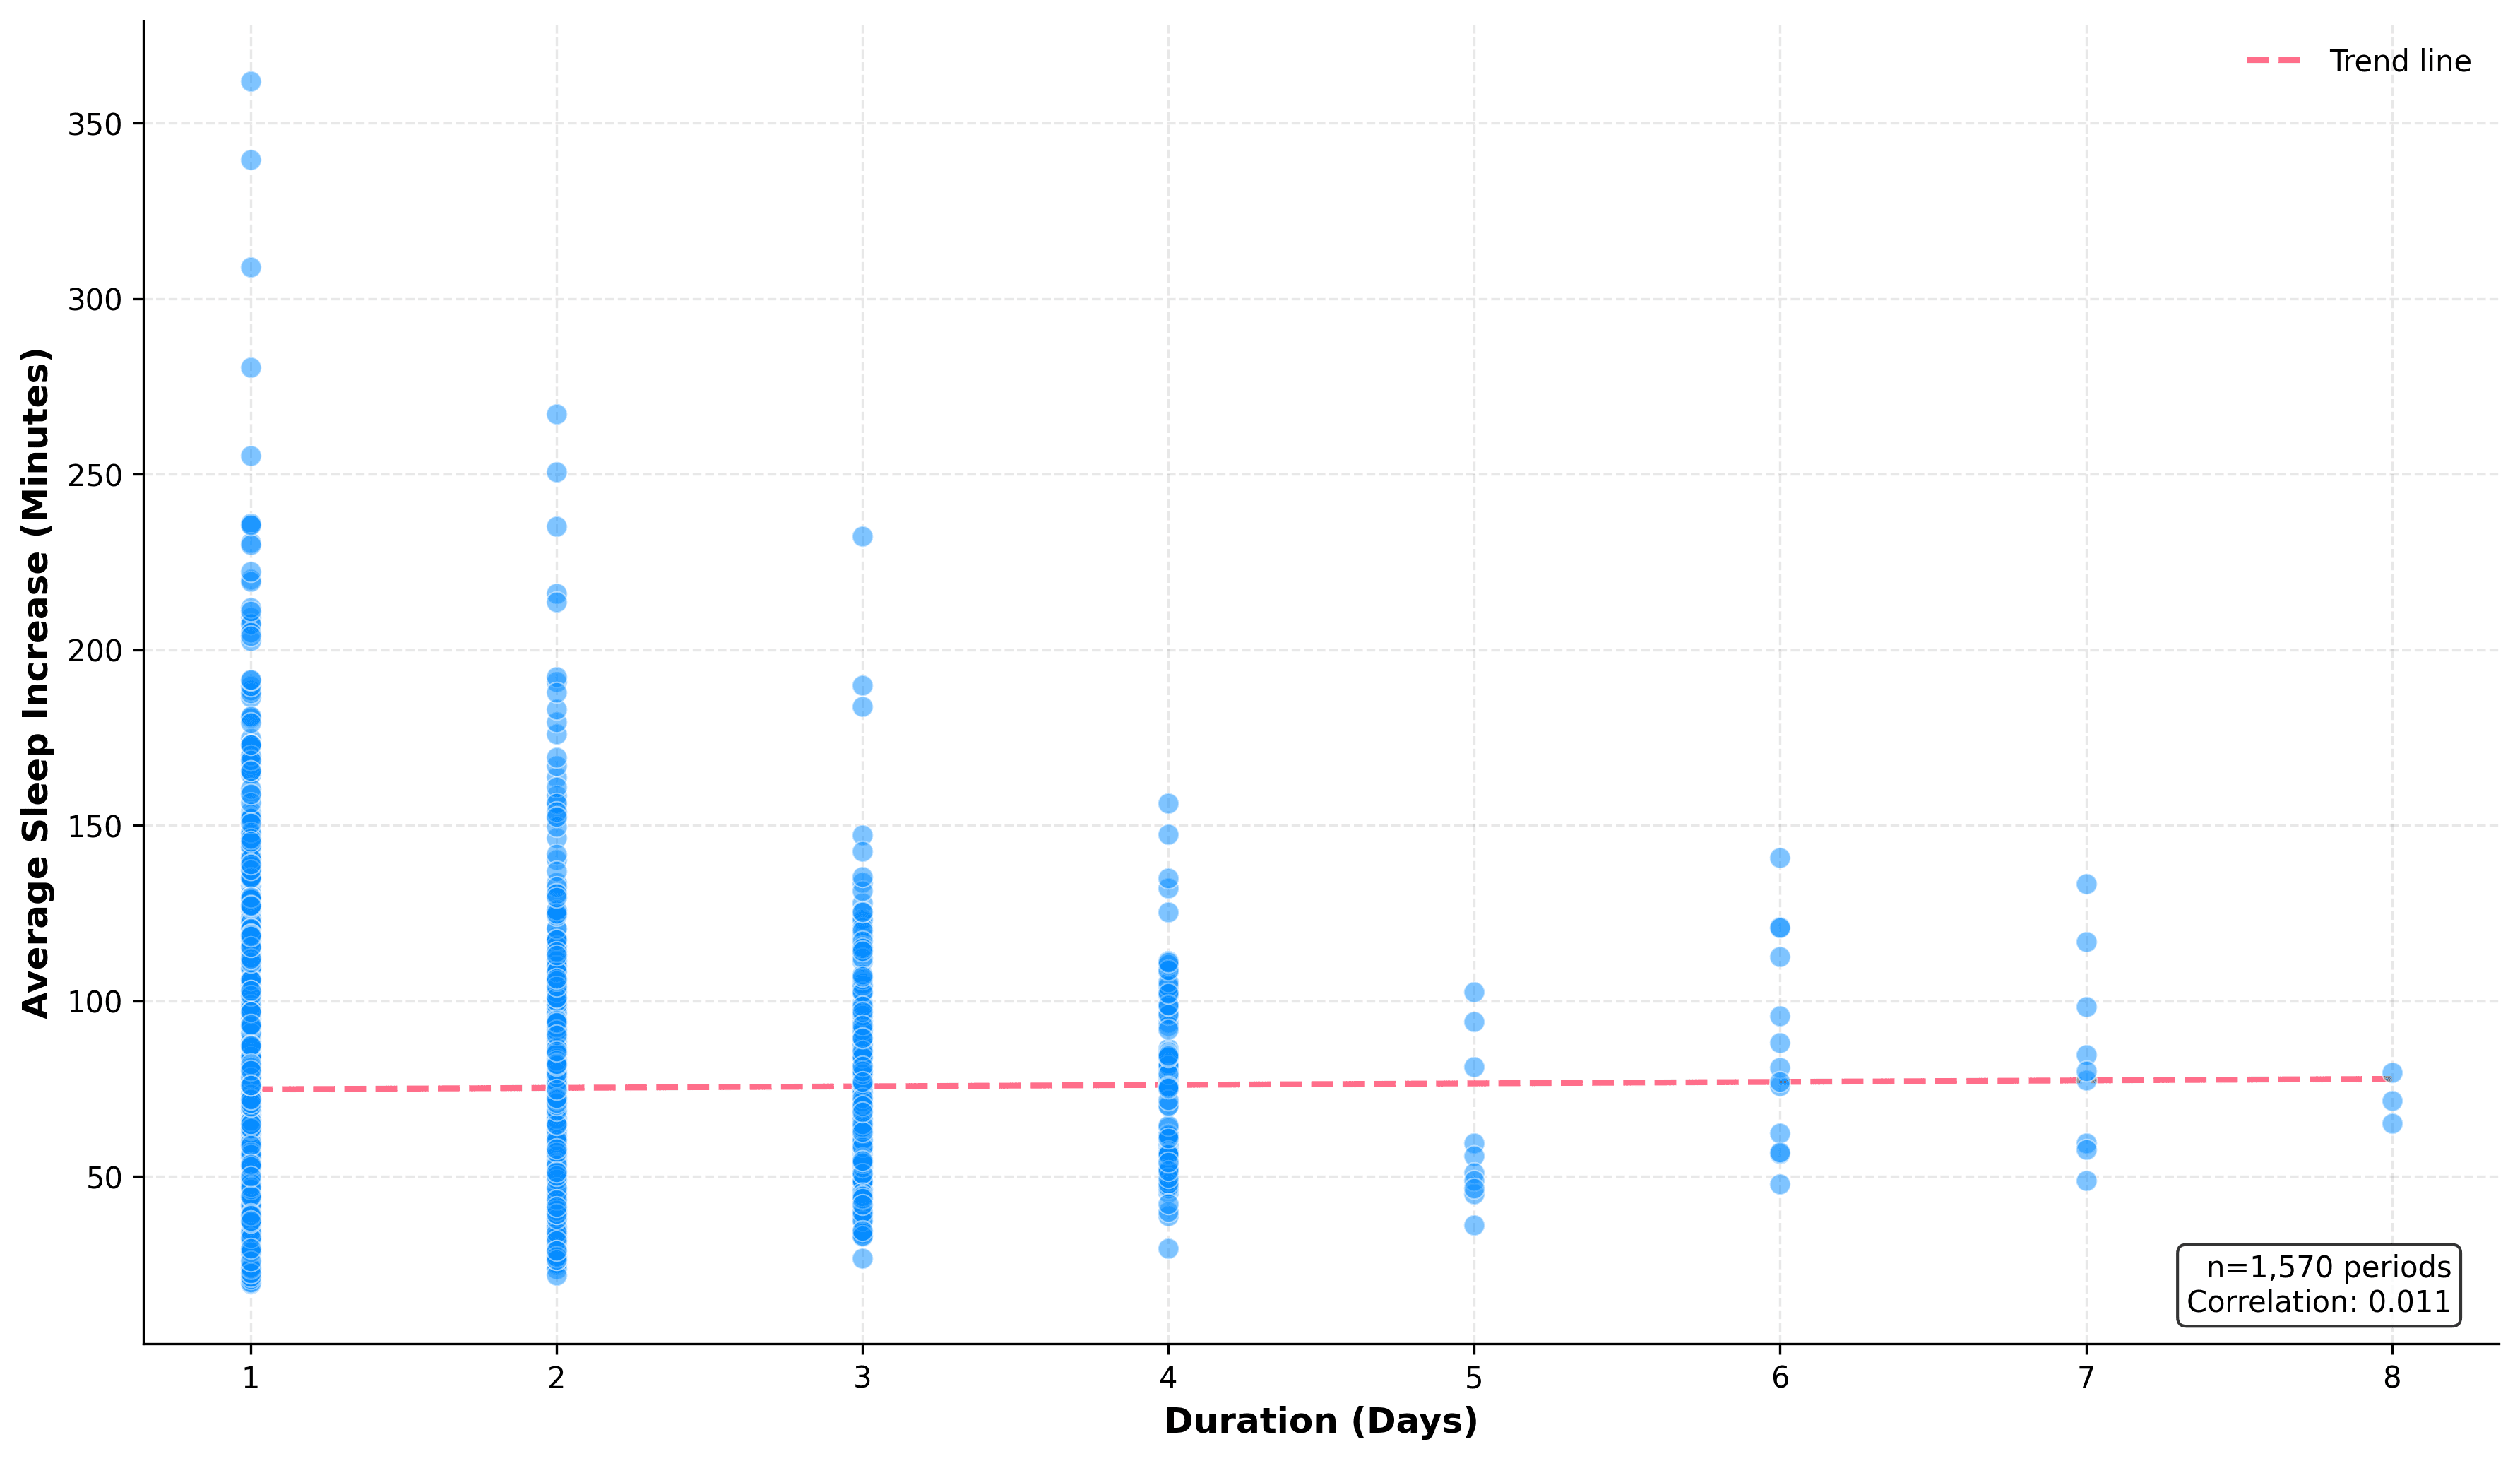
Figure 4: Duration of January 2 Sleep Increases: This bar chart counts how many users maintained a 5%+ increase above their personal baseline starting January 2 (capped at January 10). It dramatically shows the heavy skew toward brevity, with most periods ending after just 1–2 days.
Nothing drives home the transience quite like duration statistics. Among users who met the threshold (+5% over day-adjusted baseline), the median streak was 1 day. Fully 80.6% managed only 1–2 days before dropping back. Extended success was rare: fewer than 3% kept it going 5+ days, and just six people (0.4%) reached the January 10.
Some lasted more, of course, but the numbers are so small they ruined the graph! So they’re omitted here. The bars plunge sharply after day 2–3, visualising how quickly the initial resolution faded for the vast majority.
Magnitude vs. Duration of January 2
Figure 5: Magnitude vs. Duration of January 2 Increases: Each point represents one user's January 2 period, plotting extra minutes slept (magnitude) against days maintained (duration), with a regression trend line. The dense bottom-left cluster highlights the most achieving small, short gains, while the sparser top-right points show rare, sustained, larger improvements.
When we map how much extra sleep people gained against how long they sustained it, clusters emerge. The densest group sits bottom-left: modest boosts (20–40 minutes) lasting 1–2 days. Bigger leaps scatter upward but rarely extend rightward—suggesting ambitious starts often burned bright but brief. A few steady souls occupy bottom-right: small, sustainable gains over more days. The near-flat trend line (weak correlation) underscores that there is no universal formula; success depended more on personal factors than on initial scale.
Weekend vs. Weekday Differences Over Time
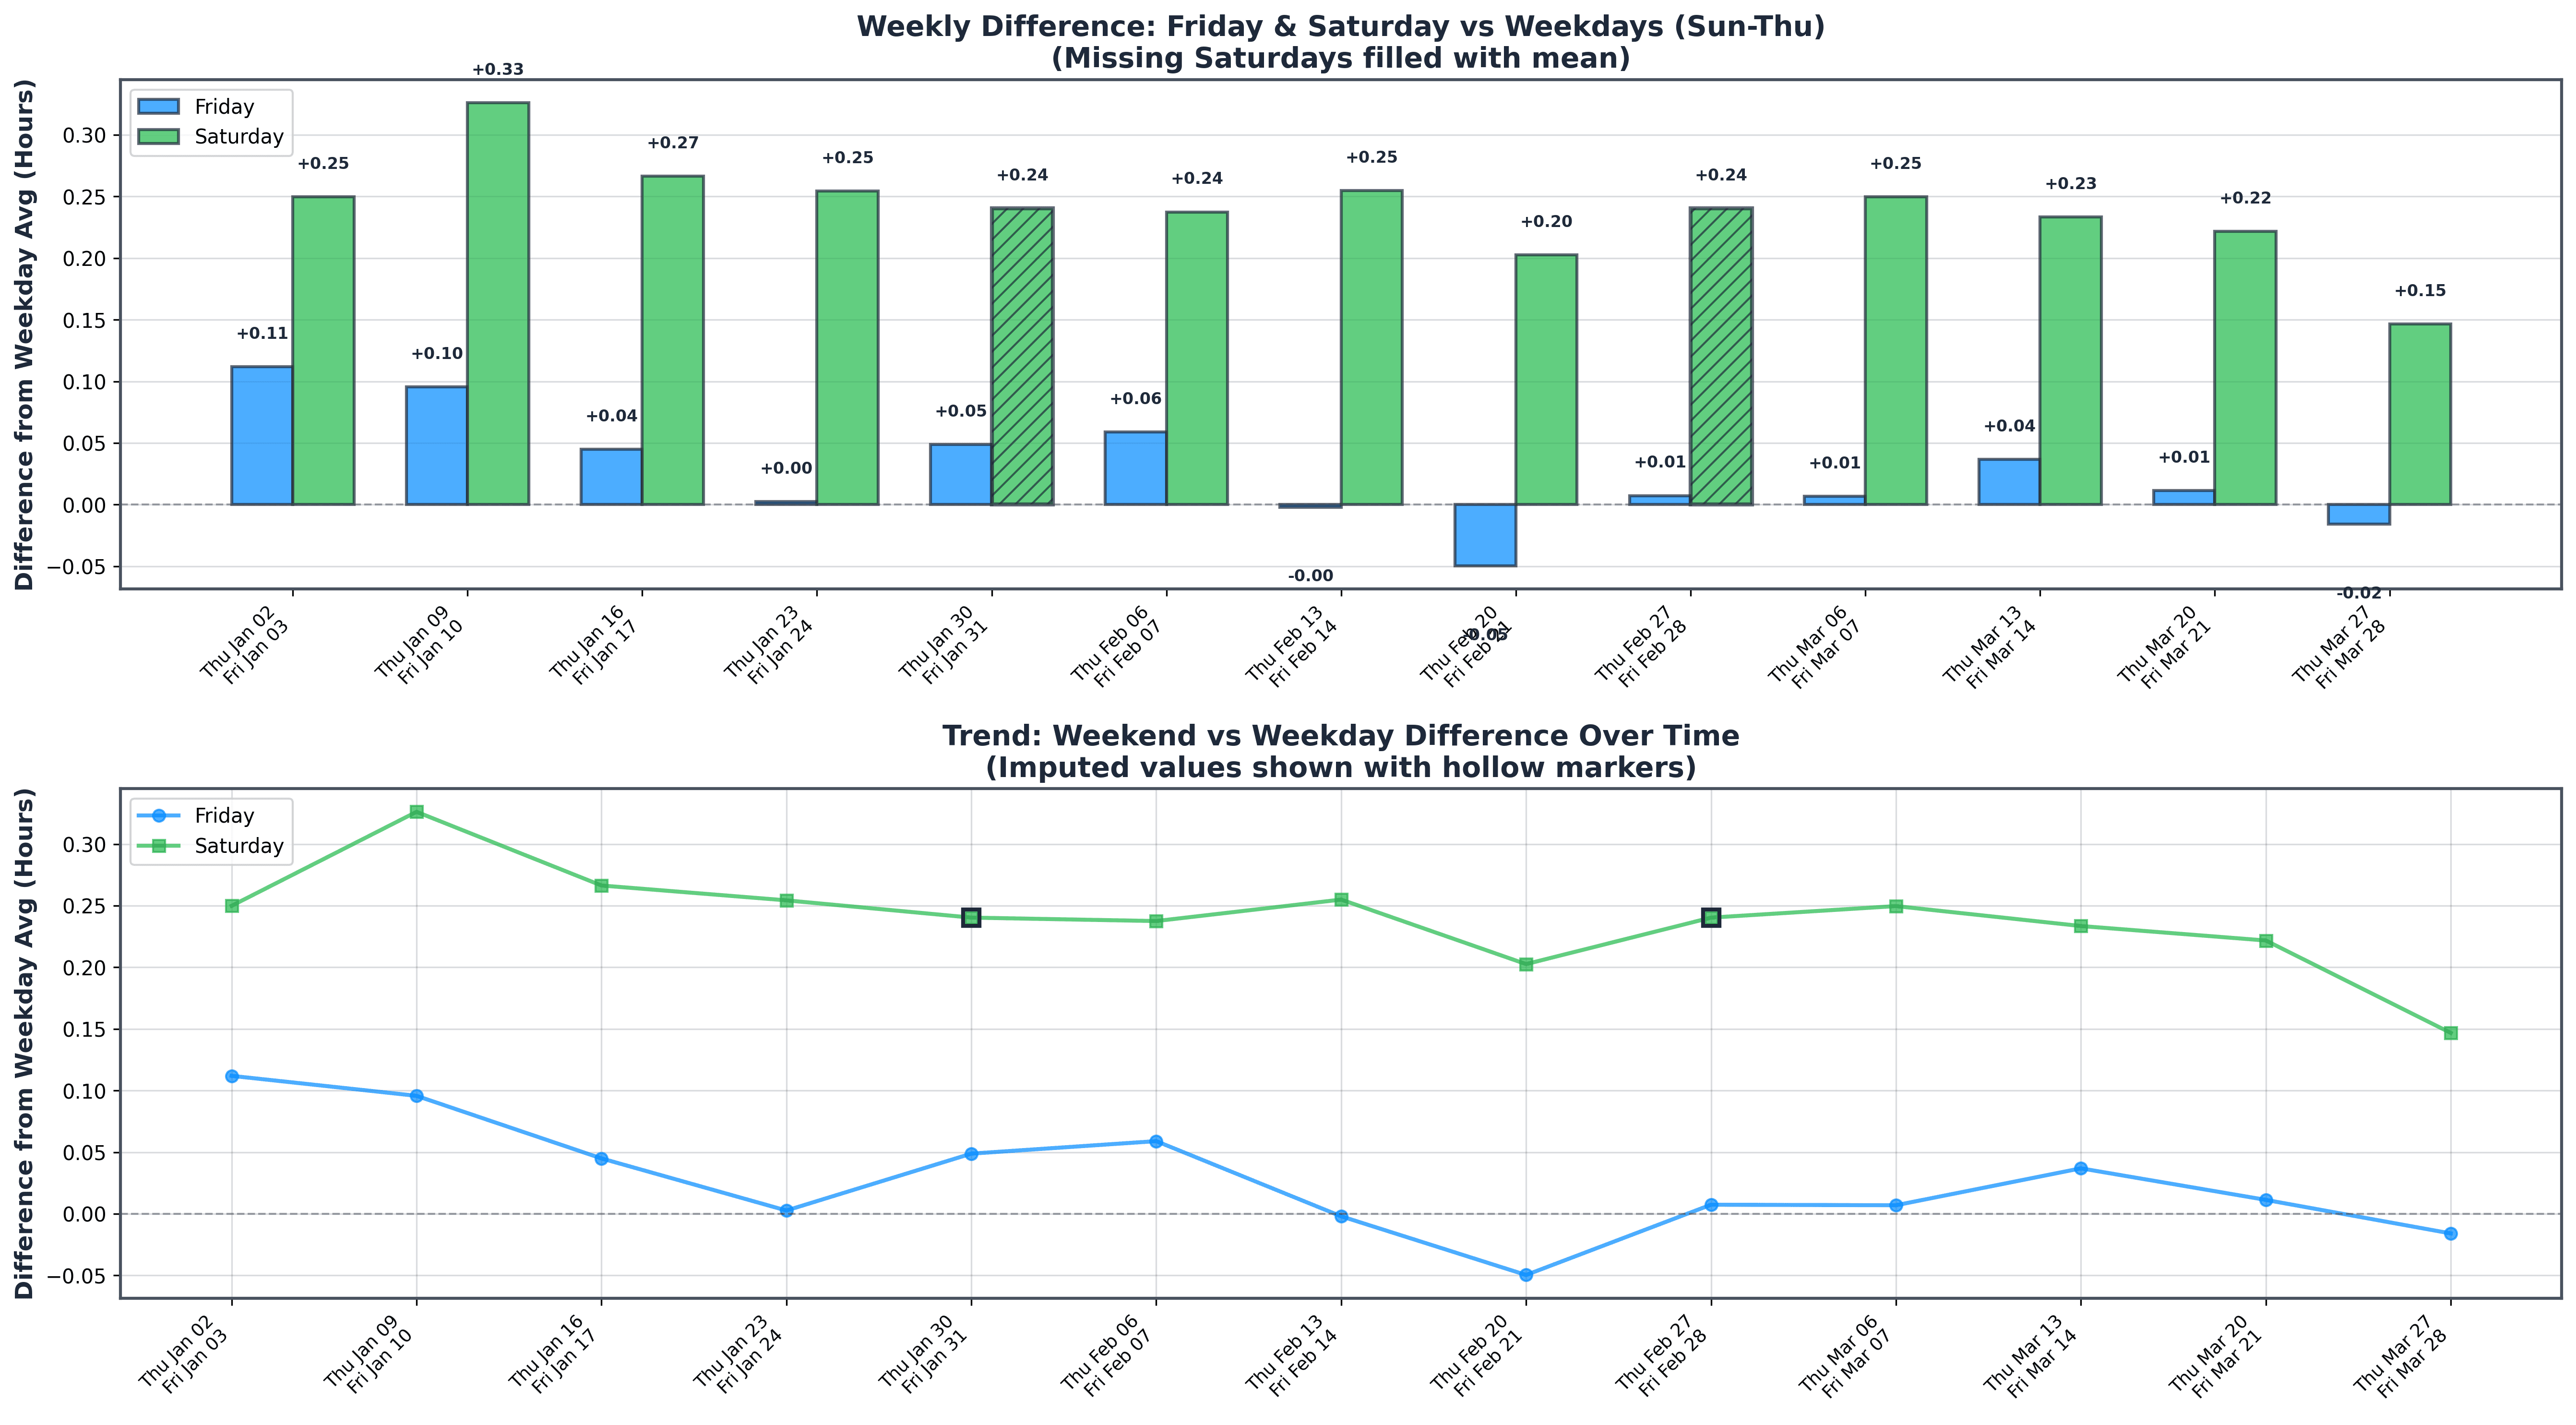
Figure 6: Weekend vs. Weekday Differences Over Time: The top panel details Friday/Saturday advantages weekly; the bottom tracks trends (imputed values marked). Weekends consistently delivered extra sleep, with January—especially early Saturdays—showing the strongest premium, supporting post-holiday catch-up efforts.
We thought we might see the most significant gains on weekends, as people do a bit less socialising on a January weekend and a bit more sleeping, and we were right. Weekends generally proved reliable havens throughout Q1, adding about 14 minutes on average versus weekdays. January weekends shone brightest: Saturdays averaged a quarterly high of 7.62 hours, and Fridays weren't far behind.
A quick note on compliance
Digging into compliance (days the device was worn), we see a counterintuitive twist. Early January (Jan 2–10) showed lower average compliance (56.1%) than the rest of Q1 (63.5%), a statistically significant drop. Yet the median was actually higher (77.8% vs. 70.0%), meaning many users wore their devices every single day in that first stretch, while a minority dragged the average down. Individual-level analysis reveals a near-perfect split: 49.5% increased compliance in early January compared to their baseline, 48.7% decreased, and 42.7% hit unusually high levels (above their own 75th percentile).
The lower average likely reflects disrupted holiday routines, forgotten charging, or starting use later in the month, but the sizable group who ramped up usage provides clear evidence that a meaningful portion treated January as a fresh start for consistent tracking. Another New Year's Resolution finding, and one we hadn’t planned on finding before the analysis!
Reflections on Resolution Reality
Synthesising everything, the New Year's Resolution sleep push is undeniably real in this dataset. Population averages ticked up in January, and we can see individual efforts in the data. Weekends become even more focused on recovery. For perhaps 60% of motivated users, early January showed behavioural differences. Compliance patterns show both enthusiasm and struggle, with a large cohort stepping up their device use right when the calendar changed.
Yet the effect's fragility stands out just as clearly. Gains were minutes, not hours. Latency worsened alongside increased sleeping. We found this interesting; it suggests that people are trying to sleep more than they can in this period. Possibly a focus on early nights? Most personal streaks died within days. By February, the slate was essentially clean: shorter nights, better onset, New Year’s resolutions over.
Why does this happen? The data offers clues without judgment. We think forced early bedtimes without circadian alignment prolong latency. Ambitious leaps (especially in sleep time) prove unsustainable. Life—work, stress, and social commitments—reassert themselves quickly. The subset who occasionally lasted longer often chose moderation over magnitude - a pattern we’ve seen before in our data Research.
There's no shame in this pattern; it's deeply human. Sleep isn't isolated; it's intertwined with routines, light exposure, evening habits, and emotional state. Dramatic January resets ignore that complexity.
The encouraging flip side: minor, consistent adjustments showed occasional staying power. Weekend premiums persisted all quarter. Some users found sustainable grooves without heroic effort.
If you're planning for 2026, let this data guide you. Start small. Protect weekends for recovery. Align changes with your natural rhythm rather than calendar pressure. Real improvement compounds over months, not days. In the next blog, we’ll turn our New Year’s Resolution focus to exercise regimes.
Sleep well and Happy New Year!
Summary questions
Is the New Year's sleep resolution effect actually real?
Yes, but it's small. Analysis of 559,468 sleep nights from 11,298 users in Q1 2025 showed January averaged 7.37 hours of sleep versus 7.32 hours in February and March — a statistically significant but tiny 5-minute bump. The effect is real at population scale, but in daily life it's nearly imperceptible.
How long do most people actually keep their sleep resolution going?
Not long at all. Among users who hit a 5%+ increase above their personal baseline starting January 2, the median streak lasted just 1 day, and 80.6% dropped back within 1–2 days. Fewer than 3% sustained gains for 5+ days, and only 6 users (0.4%) made it to January 10. Resolution sleep is measured in days, not weeks.
Why am I tossing and turning more when I try to sleep earlier in January?
Because forcing extra time in bed doesn't align with your circadian rhythm. January sleep latency averaged over 26 minutes versus 23–24 minutes later in the quarter — meaning people spent longer in bed but struggled more to fall asleep. Going to bed earlier without a proper wind-down routine backfires; your body simply isn't ready yet.
Do bigger sleep resolutions work better than smaller ones?
No — the opposite tends to be true. The magnitude-versus-duration analysis showed ambitious leaps (lots of extra minutes) rarely extended in duration, while the sustainable wins came from modest gains held over more days. The trend line was nearly flat, meaning starting big offered no advantage. Moderation outlasted magnitude.
How much do weekends really help with catch-up sleep?
Quite a bit, and especially in January. Weekends added about 14 minutes on average versus weekdays across Q1, but January Saturdays peaked at 7.62 hours — the highest of the quarter. If you're going to protect any sleep window, the data says weekends are where recovery actually sticks.
Did people wear their trackers more consistently in January?
It's split almost down the middle. Average compliance was actually lower in early January (56.1%) than the rest of Q1 (63.5%), but the median was higher (77.8% vs. 70.0%) — meaning a dedicated cohort wore their device every day while others lagged. At the individual level, 49.5% increased compliance versus baseline and 42.7% hit unusually high levels, showing a meaningful fresh-start effect on tracking itself.
Can wearable data actually detect resolution behaviour at the individual level?
Yes, clearly. Among users who started an above-baseline streak on January 2, 60% showed a period that was statistically distinct from their typical Q1 patterns — and nearly 40% still stood out under stricter 90th-percentile criteria. This isn't aggregate noise; the resolution effect is visible in individual sleep traces, with magnitude driving more of the difference than duration.
What's the best way to actually improve my sleep in the new year?
Start small and prioritise consistency over ambition. The data shows dramatic January resets fail within days — gains erode, latency worsens, and most users return to baseline by February. The few who sustained improvement chose moderation over magnitude, leaned on weekend recovery, and aligned changes with their natural rhythm rather than fighting their circadian clock.