We use cookies to enhance your browsing experience and analyse our traffic. By clicking “Accept All”, you consent to our use of cookies according to our Cookie Policy. You can change your mind any time by visiting out cookie policy.
Based on an analysis of nearly 100,000 HRV records, this report reveals that most daily HRV changes are small, but larger swings signal significant stress or recovery. The findings show a clear weekly pattern: positive HRV changes (recovery) are most common on Mondays and Tuesdays, while negative changes (fatigue) cluster on weekends.
HRV rebounds early in the week (A validation of last week’s finding!) The strongest positive swings in HRV occur on Monday and Tuesday, suggesting that the nervous system tends to recover. Possibly a delayed recovery after weekend rest. Maybe we should all do our hardest training on a Tuesday?
Negative swings cluster at weekends. Drops in HRV are most frequent on Saturdays and Sundays, likely reflecting cumulative fatigue, social strain, alcohol, or later nights.
Big HRV changes are rare but meaningful. Only about 4% of daily HRV shifts exceed ±2 standard deviations, but these moments signal significant physiological stress or recovery. Tracking these outliers helps identify when the body is truly under strain or bouncing back.
Descriptive HRV using Z scores
In the last blog, we looked at the general patterns of HRV and Sleep data for a population of sleep tracker users. We described the population's absolute and delta HRV, as well as sleep data, using the means, which revealed the general pattern. This week, we go a little deeper. Firstly, by standardising the data using Z-scores and secondly, by looking at individual variable links.
The analysis involved nearly 100,000 HRV records from April to June 2025, collected from 1,199 users of wearable devices. Our goal? Understand the magnitude and direction of daily HRV changes and determine if these changes follow meaningful patterns across days of the week.
We used a general HRV metric, which is calculated using several appropriate overnight sample periods using the RMSSD method.
Get the latest Terra Research reports and insights every week as soon as they're published.
While raw HRV can be a helpful snapshot of autonomic recovery, how HRV changes from one day to another is more meaningful. A large drop in HRV might signal poor sleep, late-stage fatigue, or elevated sympathetic stress (or all of the above!) A rebound might reflect recovery, adequate rest, or reduced strain. But — critically — a 10 ms drop means very different things for different people. That’s where z-scores come in. It allows us to “smooth” the data and compare the magnitude of HRV changes.
A z-score lets us measure how far a daily HRV change deviates from a person’s typical variability. Instead of using a fixed threshold, such as “±10 ms”, we use the individual’s mean and standard deviation to define significance. A z-score of +2 is probably a strong signal of recovery. “This HRV increase was two standard deviations larger than usual.” A z-score of minus 2 means “this was an unusually large drop in HRV” — potentially a flag for stress or strain.
Using z-scores allows us to: compare different users on a fair playing field, quantify physiological surprises and track extreme events, not just typical trends. I can hear the statisticians shouting at me at this point, but are delta HRV Z-Scores normally distributed!? The answer is not quite. But we are not using Z-scores here to make strict inferences, just as a way to standardise different days’ scores for comparison.
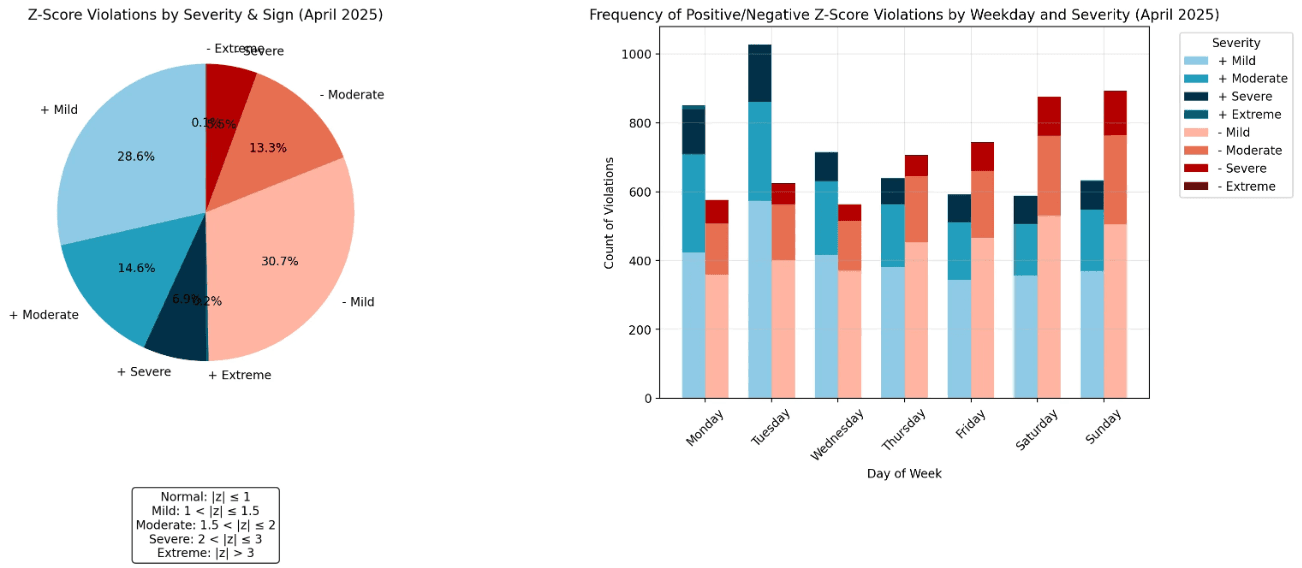
Defining HRV Violation Severity
Here’s how we bucket HRV delta z-scores based on their severity:
Severity
Z-Score Range
Positive frequency %
Negative frequency %
Normal
-1 ≤ z ≤ +1
66.25
67.7
Mild Violation
1 <
19.15
19.98
Moderate Violation
1.5 <
9.79
8.66
Severe Violation
2 <
4.64
3.58
Extreme Violation
3 <
0.16
0.07
Table 1: HRV delta z-scores split by severity
Key Findings
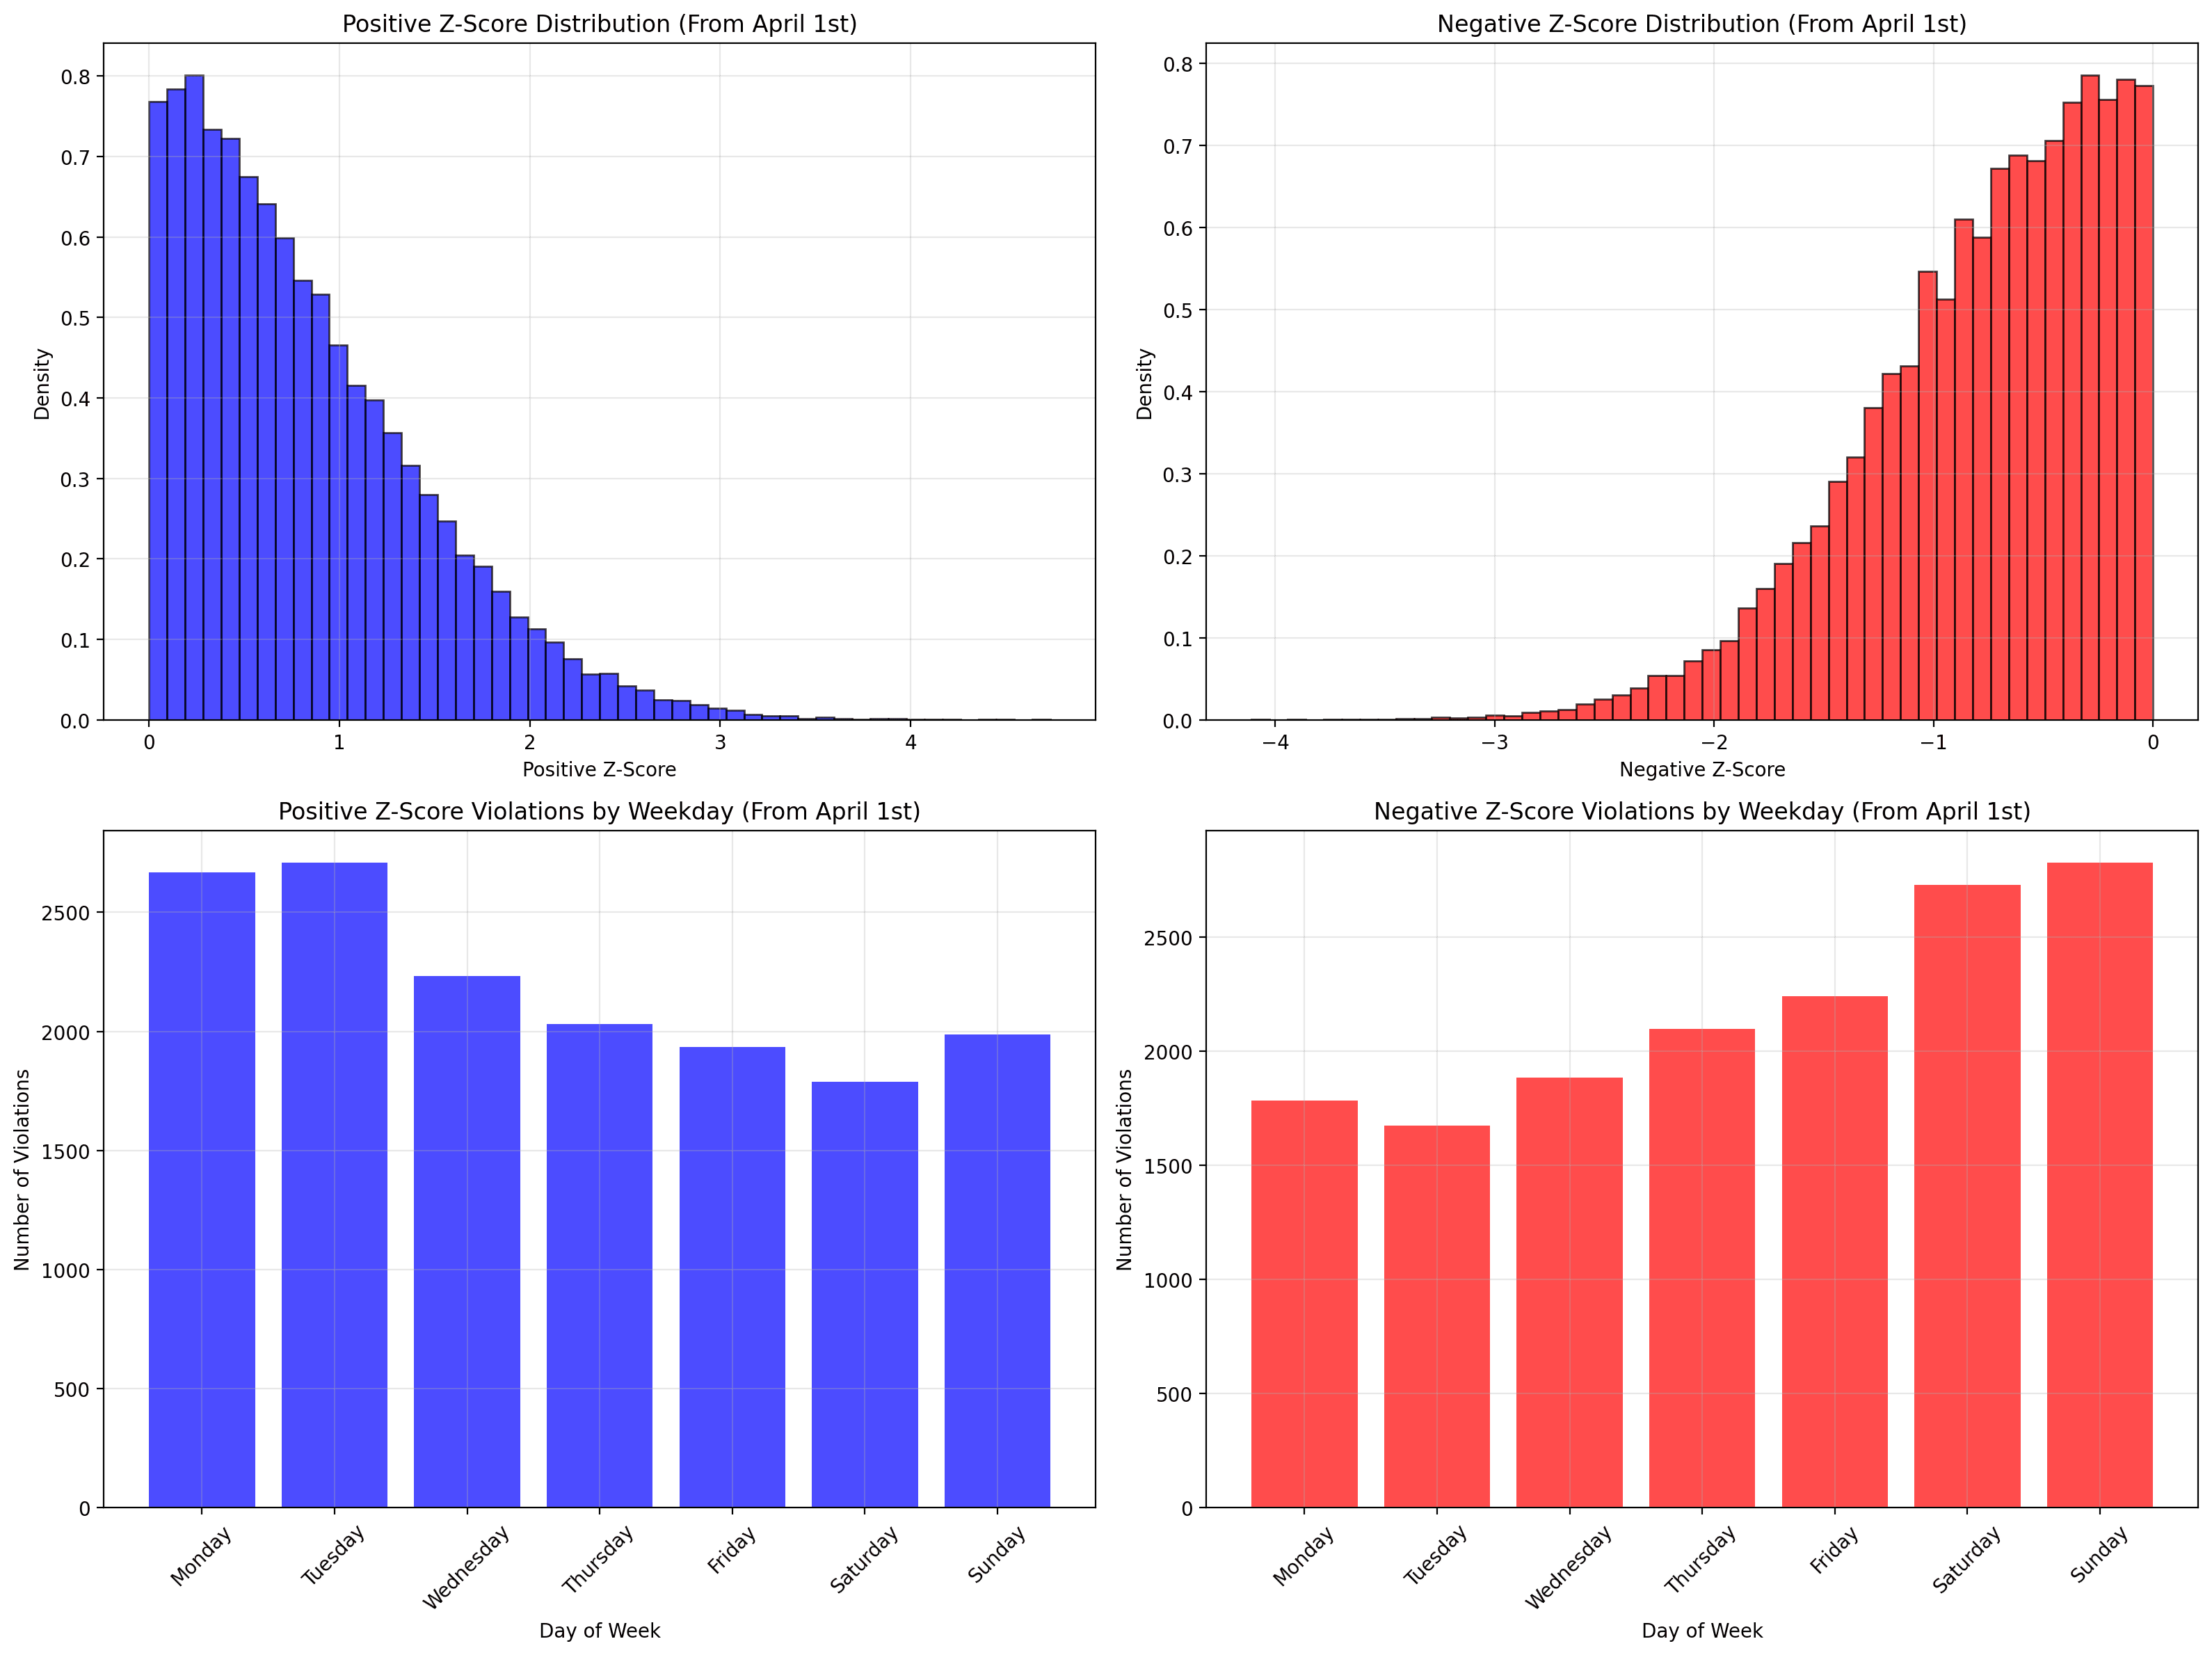
From April 1st to June 24th, 2025, we analysed, 95,623 daily HRV deltas, across 1,199 users.
Z-score overview:
There were 46,365 (48.5%) positive Z-scores, 49,150 (51.4%) negative Z-scores. With 30,584 (32%) violations over Z=1 and 4,210 (4.4%) violations over Z=2. The mean positive Z-score was +0.825, and the mean negative Z-score was -0.778.
Breakdown by Severity
Figure 1: Z-Score Violation Severity Distribution and by weekday
Most HRV swings fall into the mild or moderate category, but severe or extreme drops still occurred in more than 1 in 100 cases — suggesting meaningful day-to-day stressors are not rare, and the possibility of noise based outliers.
Weekly Patterns: When Swings Happen
You can see from figure 1 that large positive HRV changes tend to happen early in the week with negative changes happening more frequently over the weekend.
The implications here are striking and back up the trends we identify in our last blog. HRV tends to rebound early in the week, following weekend rest — but dips sharply again by Sunday, likely reflecting the cumulative load of the workweek or weekend activity.
Figure 2:Z-Score violation breakdown by frequency
What Does This Tell Us?
This data suggests a few takeaways for users, coaches, and anyone interested in nervous system recovery:
Your HRV is most likely to rebound on Monday or Tuesday — as we summerised last week, don’t skip the start of the week.
Negative swings are most common on weekends — we are guessing here, but possibly due to overreaching, alcohol, social strain, or late nights!
Big changes are relatively rare — but they matter. The 4% of changes greater than z=2 represent moments of physiological significance.
Delta HRV moves in similar positive and negative jumps. This surprised us. Our personal experience is that the negative jumps tend to be larger than the positives.
Final Thought
Recovery is very dynamic, not static, and often HRV is looked at solely in terms of multi-day trends. We wanted to investigate delta HRV and Z-scores to see if any insights emerged from trying to look at a more dynamic HRV based metric.
In reality this tell us what we already know; our HRV is in constant flux, mostly involving small changes and less frequently involving large changes. The one surprise, for us, that did emerge was that the positive swings are slightly larger, but more concentrated in terms of the days they occur on. The trend is for people to show relatively larger recovery over Sunday and Monday nights followed by a downward trend of relatively smaller negative swings during the week.
If your HRV takes a dive on Sunday — maybe skip the extra set on Monday. If it spikes on Tuesday? Lets go for it!
Summary questions
Why is delta HRV more useful than my raw HRV number?
Raw HRV is a snapshot, but day-to-day change reveals whether you're recovering or accumulating strain. A 10 ms drop means very different things for different people, which is why this analysis of 95,623 daily HRV deltas across 1,199 users used z-scores instead of fixed thresholds. The z-score approach measures how far a change deviates from your personal variability, making signals comparable across individuals.
How often does my HRV actually swing in a meaningful way?
Across nearly 100,000 HRV records, about 66-68% of daily changes fell into the normal range (z between -1 and +1). Roughly 32% of days produced a violation above z=1, but only 4.4% exceeded z=2 and a tiny 0.07-0.16% reached extreme territory (z>3). Big physiological surprises are real but rare — most days, your nervous system is just noisily stable.
Are negative HRV drops actually larger than positive rebounds?
No — and this surprised the analysts. The mean positive z-score was +0.825 while the mean negative z-score was -0.778, so positive swings were actually slightly larger in magnitude. Despite the common feeling that bad nights hit harder than good nights help, the data shows recovery jumps and stress dips are roughly symmetric.
What day of the week is my HRV most likely to rebound?
Monday and Tuesday. Large positive HRV changes cluster early in the week, consistent with recovery from weekend rest. If you're going to push a hard session, the data supports leaning into it on a Tuesday when your autonomic system is most likely showing a genuine rebound signal.
Why does my HRV crash on weekends?
Negative z-score violations occur most frequently on weekends, with 51.4% of all daily deltas being negative overall. The likely culprits are overreaching, alcohol, social strain, and late nights — the behavioral load that doesn't show up during a structured workweek. Sunday in particular tends to mark the sharpest dip before the early-week rebound.
Can I trust z-scores if HRV data isn't perfectly normally distributed?
Yes, for this purpose. The delta HRV z-scores in this dataset weren't strictly normally distributed, but they weren't being used for formal statistical inference. Z-scores here serve as a standardization tool — putting different users on the same scale so a "big day" for one person is comparable to a "big day" for another.
How should I act on a severe HRV drop?
Treat z-scores beyond ±2 as physiologically meaningful events — they make up only about 4% of days but represent genuine signal, not noise. Practically: if your HRV dives on Sunday, skip the extra set on Monday; if it spikes on Tuesday, that's the green light to push. Recovery is dynamic, and the magnitude of the swing should scale your training response.
Does looking at HRV day-by-day actually add anything beyond multi-day trends?
It adds context about volatility, not just direction. The analysis confirmed that HRV is in constant flux with mostly small changes, but the day-of-week patterning — positive swings concentrated on Sunday/Monday nights and smaller negative swings spread across the week — only emerges when you look at deltas. Multi-day trends tell you where you're heading; delta z-scores tell you when your body is reacting.