We use cookies to enhance your browsing experience and analyse our traffic. By clicking “Accept All”, you consent to our use of cookies according to our Cookie Policy. You can change your mind any time by visiting out cookie policy.
An analysis of 1,000+ ring users examined the relationship between daily calorie expenditure and sleep metrics. Active individuals show lower resting heart rates and higher HRV at the population level, but day-to-day correlations reveal minimal acute effects. The findings suggest exercise-sleep relationships are trait-based rather than state-based, with consistent moderate activity optimising recovery while excessive calorie burn may temporarily reduce readiness and HRV, supporting a "Goldilocks zone" for optimal sleep recovery.
Active people sleep “calmer”, not necessarily longer: At the population level, higher daily calories are linked with lower sleep heart rates and slightly higher HRV, but only tiny changes in sleep duration or stages.
Day-to-day effects are real but small: Pairing yesterday’s calories with last night’s sleep shows weak associations (e.g., marginally lower sleep score and REM, slightly lower HR; tiny uptick in HRV). Once you normalise within-person (28-day z-scores), effects shrink further.
Moderation wins: Consistent, moderate activity appears best for next-night recovery (HR/HRV). Overdoing it yesterday can nudge readiness and HRV down relative to your own baseline. A case for the “Goldilocks zone” rather than extremes.
Burn More Calories, Sleep Like a Log?
Imagine this: You smash a workout and then collapse into bed expecting the sleep of the gods. Well, that’s what I hope for at the end of every tough day. But does all that activity actually translate to better sleep? At Terra, we're dedicated to exploring wearable health data to uncover those hidden gems of insight. In the previous series of blogs, we explored the connection between sleep and HRV. Today, I’m exploring the link between yesterday's calorie burn and last night’s sleep metrics, drawn from aggregated, anonymised data from wearables. Spoiler: It's not all sweet dreams, but there are some heartwarming (pun intended) surprises and a plot twist when we zoom in on personalised baselines.
I've analysed data from over 1,000 users, examining how daily active calorie expenditure —encompassing steps, workouts, and general movement—impacts sleep variables such as heart rate (HR), heart rate variability (HRV), sleep duration, and quality scores. Why calories? It's a solid proxy for the amount of physical activity a user accumulates in a day. And since sleep is the ultimate recovery mode, understanding these links could help you tweak your routine for better rest. It's obvious downsides; it doesn't fully encapsulate intensity of exercise, or when the activity was done. But more on this later.
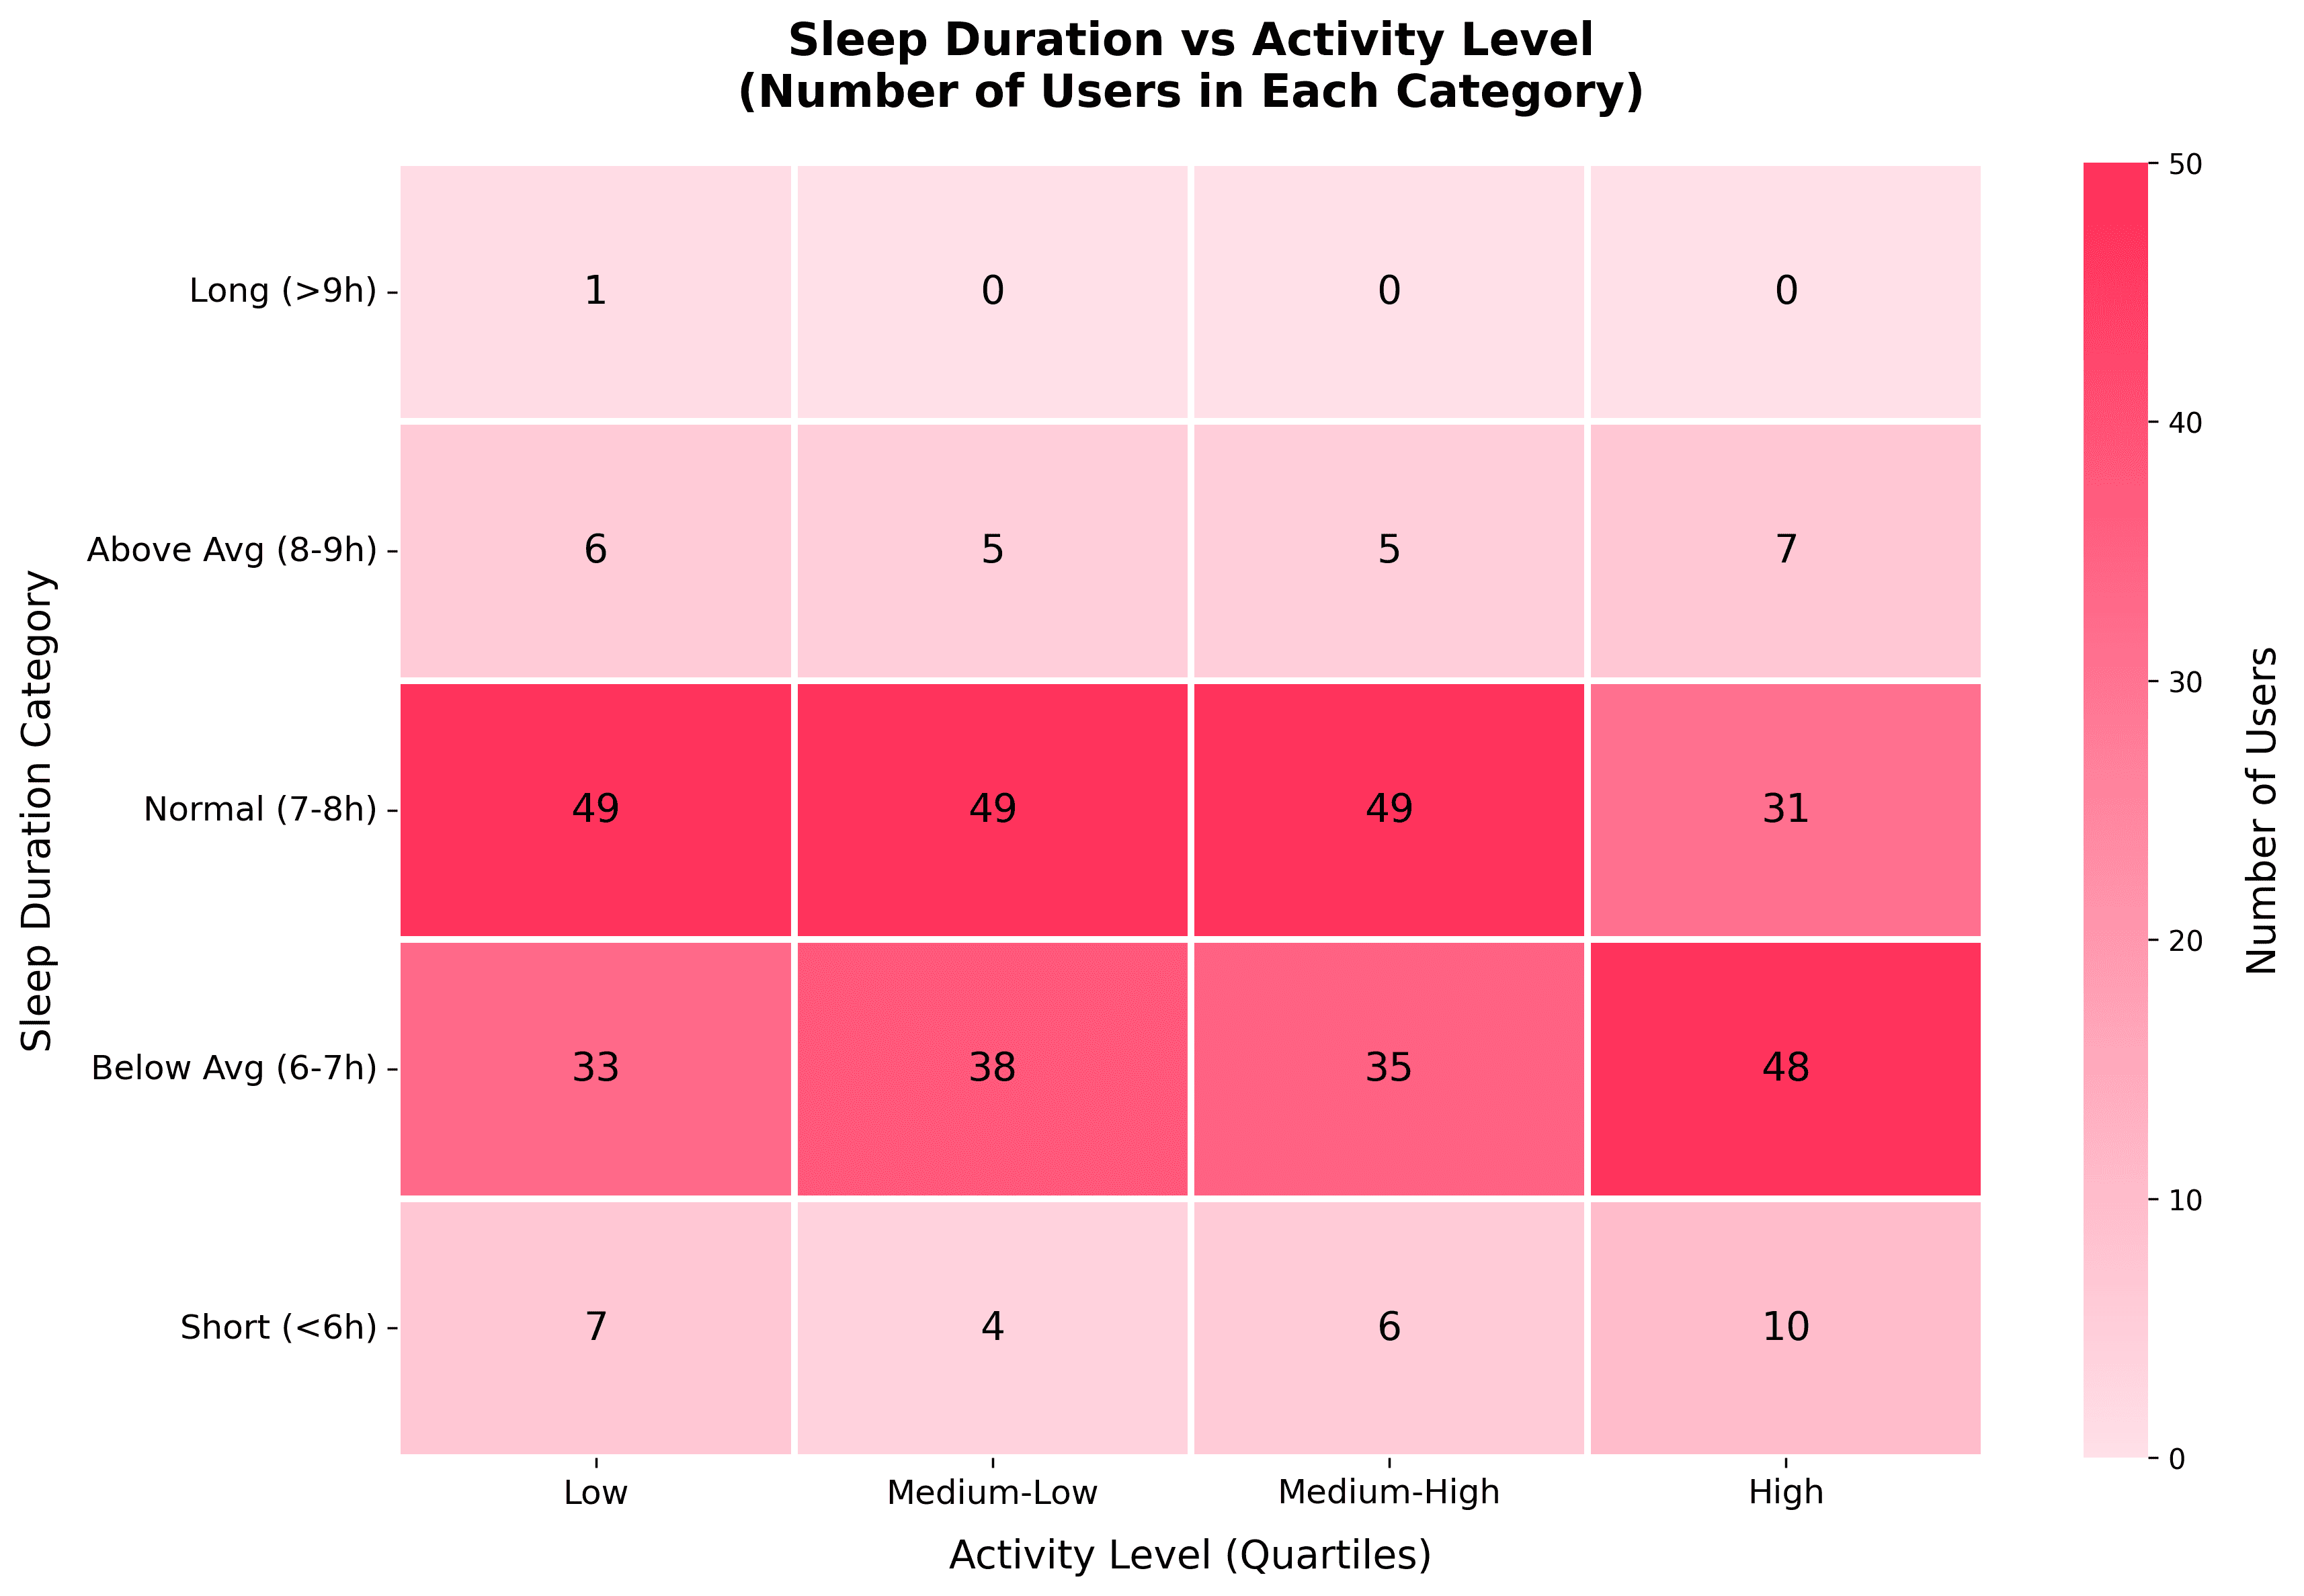
Figure 1: Matrix of sleep duration vs activity levels.
Get the latest Terra Research reports and insights every week as soon as they're published.
Population-Level Correlations: This is the big-picture view. I averaged each user's calorie burn and sleep metrics across all their days. It's like asking, "Do folks who generally burn more calories also tend to have better average sleep?"
Lagged Correlations (Non-Normalised): I paired yesterday's calories with last night’s sleep metrics for each user. This teases out potential cause-and-effect: Does burning extra calories one day predict better (or worse) sleep the next night? I used Pearson correlations, with p-values to flag statistical significance.
Person-Level Analysis with 28-Day Rolling Z-Scores. Raw metrics vary widely between individuals; one user's 2,500-calorie day might be another's couch potato baseline. Z-scores standardise data relative to each individual's recent history. This shifts focus to "Was that a higher-than-usual burn for you?" vs. "How did it affect your better/worse-than-usual sleep?" I applied it to both calories (yesterday) and sleep variables (today), analysing 23,279 day-pairs from 385 users.
I performed some basic outlier removal, removing days with more than 450 calories. That might not seem like an extreme calorific expenditure, but it was for this dataset. All effects are weak (correlations under 0.2), but that's biology for you; as we keep seeing, human bodies aren't robots. These are gentle nudges, not seismic shifts. It’s time for that warning again. We are only dealing in correlations here. Where we do suggest causation, it is just that - a theory!
The Big Reveal: Calories and Sleep at the Population Level
Let's start broadly. Across users' averages, higher calorie burn links to some intriguing sleep patterns.
Heart Rate Takes a Chill Pill: People who burn more calories on average show lower minimum HR (r = -0.20, p = 0.0002), resting HR (r = -0.20, p = 0.0002), average HR (r = -0.20, p = 0.0002), and max HR (r = -0.19, p = 0.0003) during sleep. Translation: More active lifestyles seem to dial down your heart's nighttime activity. Nothing new to see here!
HRV Gets a Boost: There's a positive correlation with average HRV (RMSSD; r = 0.16, p = 0.0024). Again, we’d expect that more exercise improves HRV, indicating resilience to stress.
Other notables: Shorter wake-up latency (r = -0.12, p = 0.031)—active users fall back asleep faster after stirring—and a slight dip in REM duration (r = -0.11, p = 0.034). Overall, 35.7% of the tested links were significant after removing outliers, with effects stronger in this dataset than in the daily data.
Yesterday's calories versus today's sleep reveals a few subtle links.
Sleep Score Suffers a Bit: r = -0.14 (p < 0.00001). Burning more calories yesterday weakly predicts a lower sleep score today.
Heart Rate Lowers Again: Echoing the population view, higher calories link to lower min HR (r = -0.09, p < 1e-20), resting HR (r = -0.09, p < 1e-20), avg HR (r = -0.09, p < 1e-19), and max HR (r = -0.07, p < 1e-14) during sleep. Good news for heart health!
HRV Edges Up: A tiny positive with avg HRV (r = 0.05, p < 1e-7). Consistent with studies linking physical activity to better HRV.
Duration and Quality Dip: REM sleep shortens slightly (r = -0.05, p < 1e-8), total asleep time too (r = -0.04, p < 2e-5). Wake-ups increase (r = 0.03, p < 0.001). Respiration slows a tad (r = -0.02, p = 0.04). In categories: HR effects were negative (calmer beats), durations negative (less sleep), recovery mixed, but effects were smaller than population-level. Why? Daily fluctuations add noise.
Here's a snapshot of top lagged correlations:
Sleep Variable (Today)
Corr (r)
P-value
Interpretation
Min HR During Sleep
-0.09
<1e-20
Weak negative: Calmer min HR
Resting HR During Sleep
-0.09
<1e-20
Weak negative: Lower resting HR
Avg HR During Sleep
-0.09
<1e-19
Weak negative: Overall calmer HR
Max HR During Sleep
-0.07
<1e-14
Weak negative: Tamed peaks
REM Duration
-0.05
<1e-8
Very weak negative: Less dream time
Avg HRV (RMSSD)
0.05
<1e-7
Very weak positive: Slight HRV boost
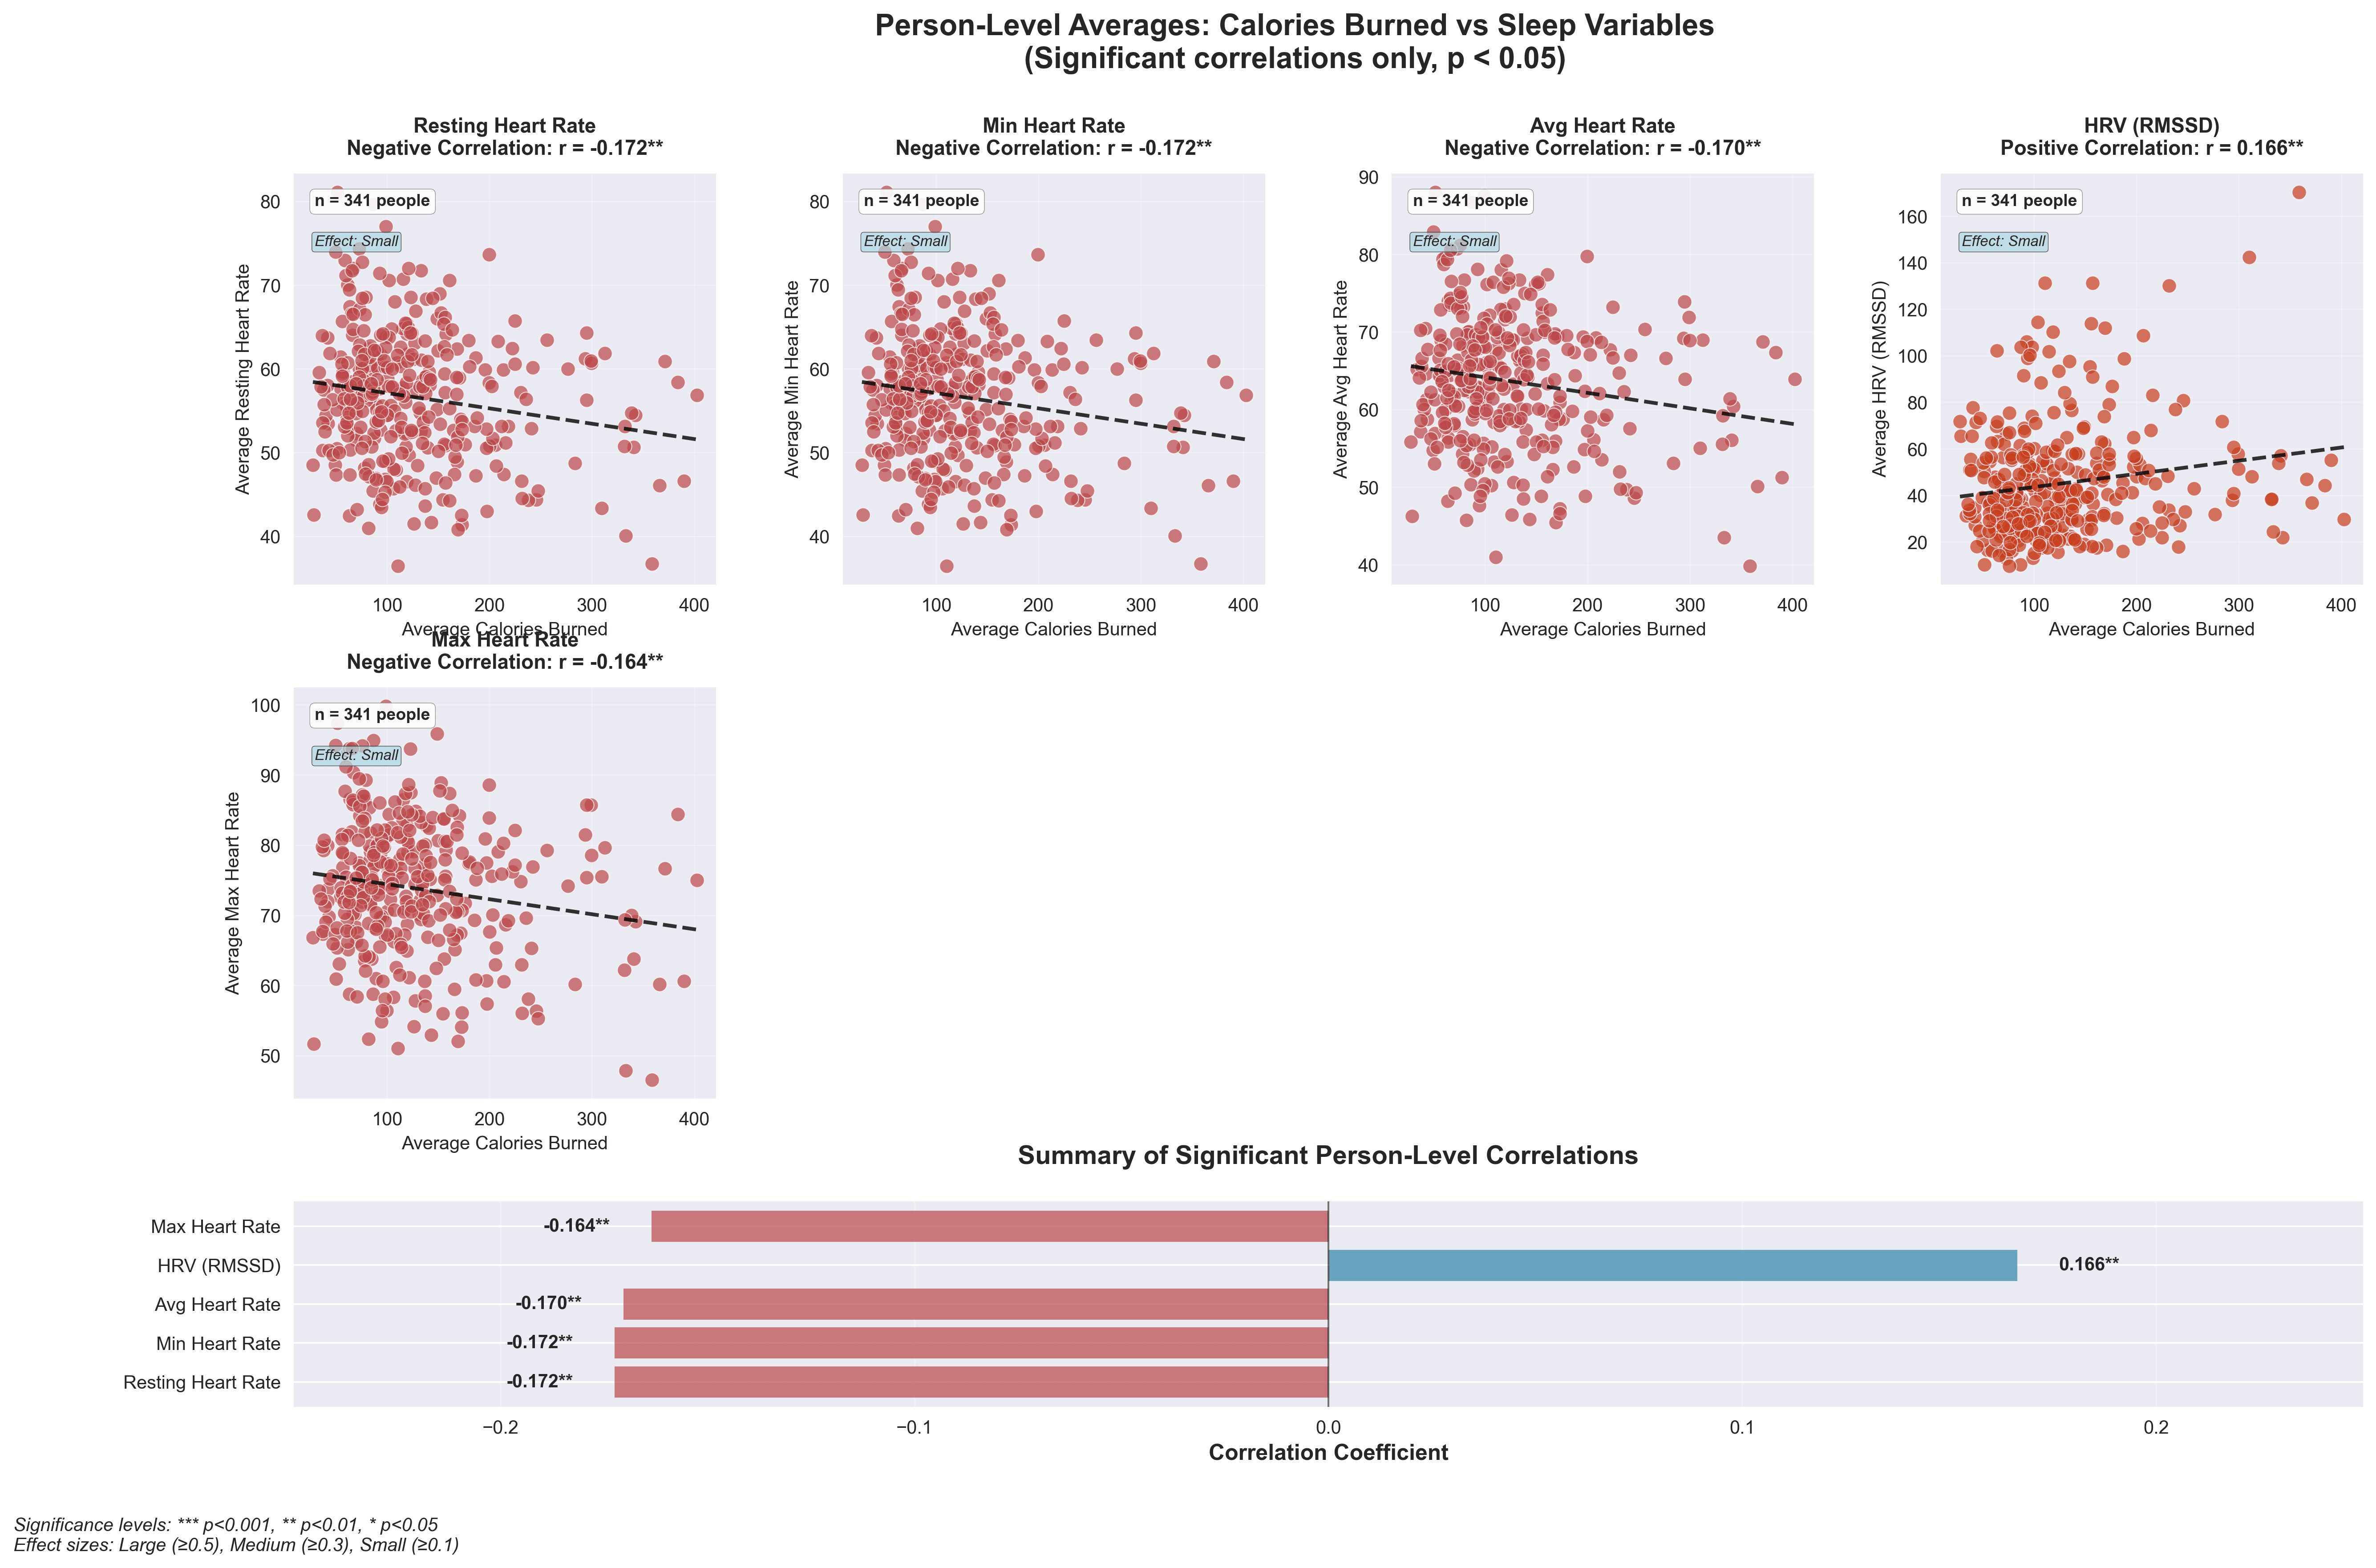
Figure 2: Person-level correlations between average calories burned and sleep variables. Heart rate metrics show weak negative correlations (r = -0.164 to -0.172), while HRV shows a weak positive correlation (r = 0.166) across 341 participants (all p < 0.05).
Person-Level Analysis with 28-Day Rolling Z-Scores
Enter the z-score refinement (again!), normalising both calories and sleep to each user's 28-day rolling baseline. This isolates deviations: "Did burning more than my usual yesterday lead to better/worse sleep than my norm today?"
Key findings: Effects are even weaker! Mean r = -0.008 (range -0.080 to +0.023), only 3 significant (p < 0.05), none strong (|r| > 0.1).
Top Significant Correlations:
Calories vs Readiness (r = -0.072, p = 0.004): Higher-than-usual calories yesterday relates to lower-than-usual readiness today. I included this for interest, but without knowing exactly what goes into this score (more on scores in later blogs), I presume that yesterday's exercise is represented somehow. Which means we have circular logic going on, and we should be finding a correlation!
HRV RMSSD (r = -0.038, p = 0.001): More calories burnt is correlated to a slightly lower HRV. Weak, but points to temporary autonomic strain.
Light Sleep Duration (r = +0.023, p = 0.049): Extra calories burnt during exercise is linked to marginally more light sleep. A faint positive!
Insights: Day-to-day exercise variations have minimal impact on normalised sleep. Negative hits on recovery measured as HRV dominate the significants, while durations barely budge. This method controls for baselines and trends, like seasonal activity spikes, making it robust
Beyond Lines: Exploring Nonlinear Relationships
To dig deeper, I tested for nonlinearity using quadratic regressions on the z-scored data—could the calorie-sleep link be U-shaped, where both too little and too much activity spell trouble? The results? A few intriguing curves, but still weak. Significant nonlinear relationships (p < 0.05) emerged for average heart rate (p = 0.014, quadratic coeff +0.022, U-shaped: both low and high exercise days link to higher sleep HR) and maximum heart rate (p = 0.027, coeff +0.019, U-shaped: similar elevation at extremes). Marginally significant (p < 0.1) was REM sleep duration (p = 0.076, coeff -0.015, inverted U: moderate exercise boosts REM, extremes cut it). Key takeaways: U-shaped cardio effects suggest sedentary days or overtraining might impair recovery, while REM hints at an "optimal" activity sweet spot. But effects are tiny (R² 0.001-0.011), explaining <0.2% variance, not strong backing for U-shaped "bad sleep" overall. Visuals like quadratic-fit scatters highlight these subtle bends.
Why the Drop-Off? Non-Normalised vs. Z-Score Differences
If you are anything like me you might wondering: Why are there stronger links without z-scores? It's a classic stats gotcha, rooted in variance types.
Between-Person Variance Inflates Non-Normalised: Raw data mixes individual traits; active users (high average calories) often differ from sedentary ones (e.g., better baseline HRV due to fitness). This creates "spurious" correlations from who you are, not daily actions. Example: High-burner averages calmer HR; low-burner doesn't. Non-normalised r spikes (e.g., -0.20 for resting HR), but it's not causal.
Trends and Confounds: Seasons (summer runs, winter slumbers) or long-term changes (improving fitness) can boost raw correlations. Z-scores strip these, focusing on short-term deviations.
Scale Effects: Absolutes amplify differences; z-scores equalise (1 SD burn means the same relative effort for all).
Confounders Galore: Age, genetics, lifestyle confound raw Z-scores control within-person, revealing true acute effects, often weaker, as seen
The bottom line here is that non-normalised shows population associations (useful for trends), but z-scores nail daily links. The weaker z-results suggest exercise-sleep ties are more trait-based than day-driven! I’ll dig deeper into this variance to see if we can identify users who are responders in future research and blogs.
What Does Science Say?
These findings align with broader research. I think cross-sectional studies probably often overestimate exercise-sleep links due to confounders. Within-person longitudinal (z-score style) shows subtler effects, as daily activity minimally disrupts sleep architecture but aids long-term. It makes sense that acute high expenditure spikes cortisol, dipping HRV and readiness next night.
Real Talk: What This Means for Your Routine
So, work hard sleep well? Moderately, yes. Consistent exercise seems cardio-protective, lowering sleep HR and upping HRV, great for stress resilience. But overdo yesterday (even relatively), and today's normalised sleep probably impacts readiness or HRV. Aim for that Goldilocks zone in the middle, avoid extremes to optimise REM and keep HR steady.
Limitations? Firstly, here we go again, correlations aren't causation. Confounders, such as diet or stress, lurk. The data is from a sample of users, we don’t know of the biases that lurk in this particular sample. Finally, the effects are very small; don't ditch the treadmill because of anything you’ve read here.
Summary questions
Does burning more calories actually help me sleep better?
Modestly, and mostly through heart-rate metrics rather than sleep duration or quality. Across 1,000+ users, those with higher average calorie burn showed lower minimum, resting, average, and max HR during sleep (all r ≈ -0.20, p = 0.0002) and slightly higher HRV (r = 0.16, p = 0.0024). But sleep score, REM, and total sleep time didn't improve — and in some cases dipped slightly.
Why does my sleep score sometimes drop after a really hard day?
The data backs that up: yesterday's calorie burn weakly but very reliably predicted a lower sleep score today (r = -0.14, p < 0.00001), shorter REM (r = -0.05), shorter total sleep (r = -0.04), and more wake-ups (r = 0.03). Acute high expenditure likely spikes cortisol and temporarily strains the autonomic system. Your heart gets calmer, but your sleep architecture takes a small hit.
Do exercise–sleep links hold up once you control for individual baselines?
Barely. After applying 28-day rolling z-scores across 23,279 day-pairs from 385 users, the mean correlation between calories and sleep variables collapsed to r = -0.008, with only 3 of the tested links statistically significant and none exceeding |r| > 0.1. Most of the apparent exercise-sleep relationship is trait-based — fitter people sleep differently — rather than driven by what you did yesterday.
Is there an optimal amount of exercise for sleep, or is more always better?
There are hints of a sweet spot. Quadratic regressions on z-scored data showed U-shaped relationships for sleep average HR (p = 0.014) and max HR (p = 0.027), meaning both sedentary and very high-burn days linked to elevated sleep HR. REM duration showed a marginal inverted-U (p = 0.076), suggesting moderate activity may support REM while extremes cut it — though these curves explain less than 0.2% of variance.
Why did the correlations get so much weaker after z-scoring?
Because raw correlations conflate who you are with what you did. Active users tend to have better baseline HRV and lower resting HR regardless of yesterday's workout, which inflates non-normalised correlations to around r = -0.20. Z-scores strip out between-person traits, seasonal trends, and long-term fitness changes, leaving only the acute day-to-day signal — which turns out to be tiny.
Does burning more calories than usual hurt my recovery the next night?
Slightly, yes. In the z-scored analysis, higher-than-usual calorie burn correlated with lower-than-usual HRV RMSSD (r = -0.038, p = 0.001) and lower readiness (r = -0.072, p = 0.004) the following night. The effects are weak, but they consistently point toward temporary autonomic strain after harder-than-normal days rather than improved recovery.
Can wearable data reliably detect how exercise affects sleep?
Yes for population trends, with caveats for daily prediction. Wearables clearly capture the cardio-protective signature of active lifestyles — lower sleep HR and higher HRV — across hundreds of users. But day-to-day causal links are noisy: all effects sat under r = 0.2, and once normalised to personal baselines most disappeared. The signal is real but small, and likely needs responder-level analysis to surface.
Should I train less to protect my sleep?
No. Consistent exercise was associated with calmer nighttime heart rate and better HRV, both markers of stress resilience. The penalty for an unusually hard day is real but minor — a small dip in readiness, HRV, and REM. Aim for the Goldilocks zone: avoid both sedentary days and personal-extreme efforts, and the cardiovascular benefits accumulate without meaningful sleep cost.