We use cookies to enhance your browsing experience and analyse our traffic. By clicking “Accept All”, you consent to our use of cookies according to our Cookie Policy. You can change your mind any time by visiting out cookie policy.
We unpack what HRV really is and how it actually works to demystify the data from Apple Watch, Fitbit, and Garmin. Some devices deliver stronger signals for daily recovery (RMSSD), tightly linked to resting heart rate, while Apple produced significantly higher variability by measuring broader autonomic balance (SDNN). The results expose a fundamental metric divide: these devices are speaking different mathematical languages, meaning your choice of wearable determines whether you are tracking training readiness or overall stress.
HRV readings differ significantly depending on both the device and the metric used (RMSSD vs SDNN).
Other devices shows stronger HRV–heart rate relationships, while Apple’s methods reflect broader autonomic balance but with more variability.
Fitbit tends to read lower, and Garmin remains stable, meaning users should not compare across devices.
Understanding HRV Across Wearables: Why Device and Metric Matter
Over the last few blogs, we've looked at how often people use different wearables and how various devices measure sleep differently. Now it's HRV's turn.
HRV stands for heart rate variability; a measure of variation in cardiac rhythm. It’s an important value that has been shown to be an indicator of severe arrhythmic complications [1].
Whether you are monitoring recovery, stress, or training readiness, HRV is probably one of the key components you check every morning. Fitbit, Garmin and Apple use a light-based sensor to detect the rhythms of the heart and the times between the beats. There are sensor differences, but also processing differences. As we have seen in other blogs, outlier exclusion, filling in data gaps, and the choice of baselines all have an impact, as does the measurement period, the number of periods required, and whether periods are included if there is movement. To make the conversation even more complex, Apple reports a different metric altogether from the other wearables.
Over the past 93 days (May–August 2025), we analyzed HRV and heart rate data from Apple, Garmin, and Fitbit, applying a strict quality filter of at least four hours of sleep per night. By comparing distributions, daily trends, and statistical relationships, we can start to see how device design, metric choice, and physiology interact.
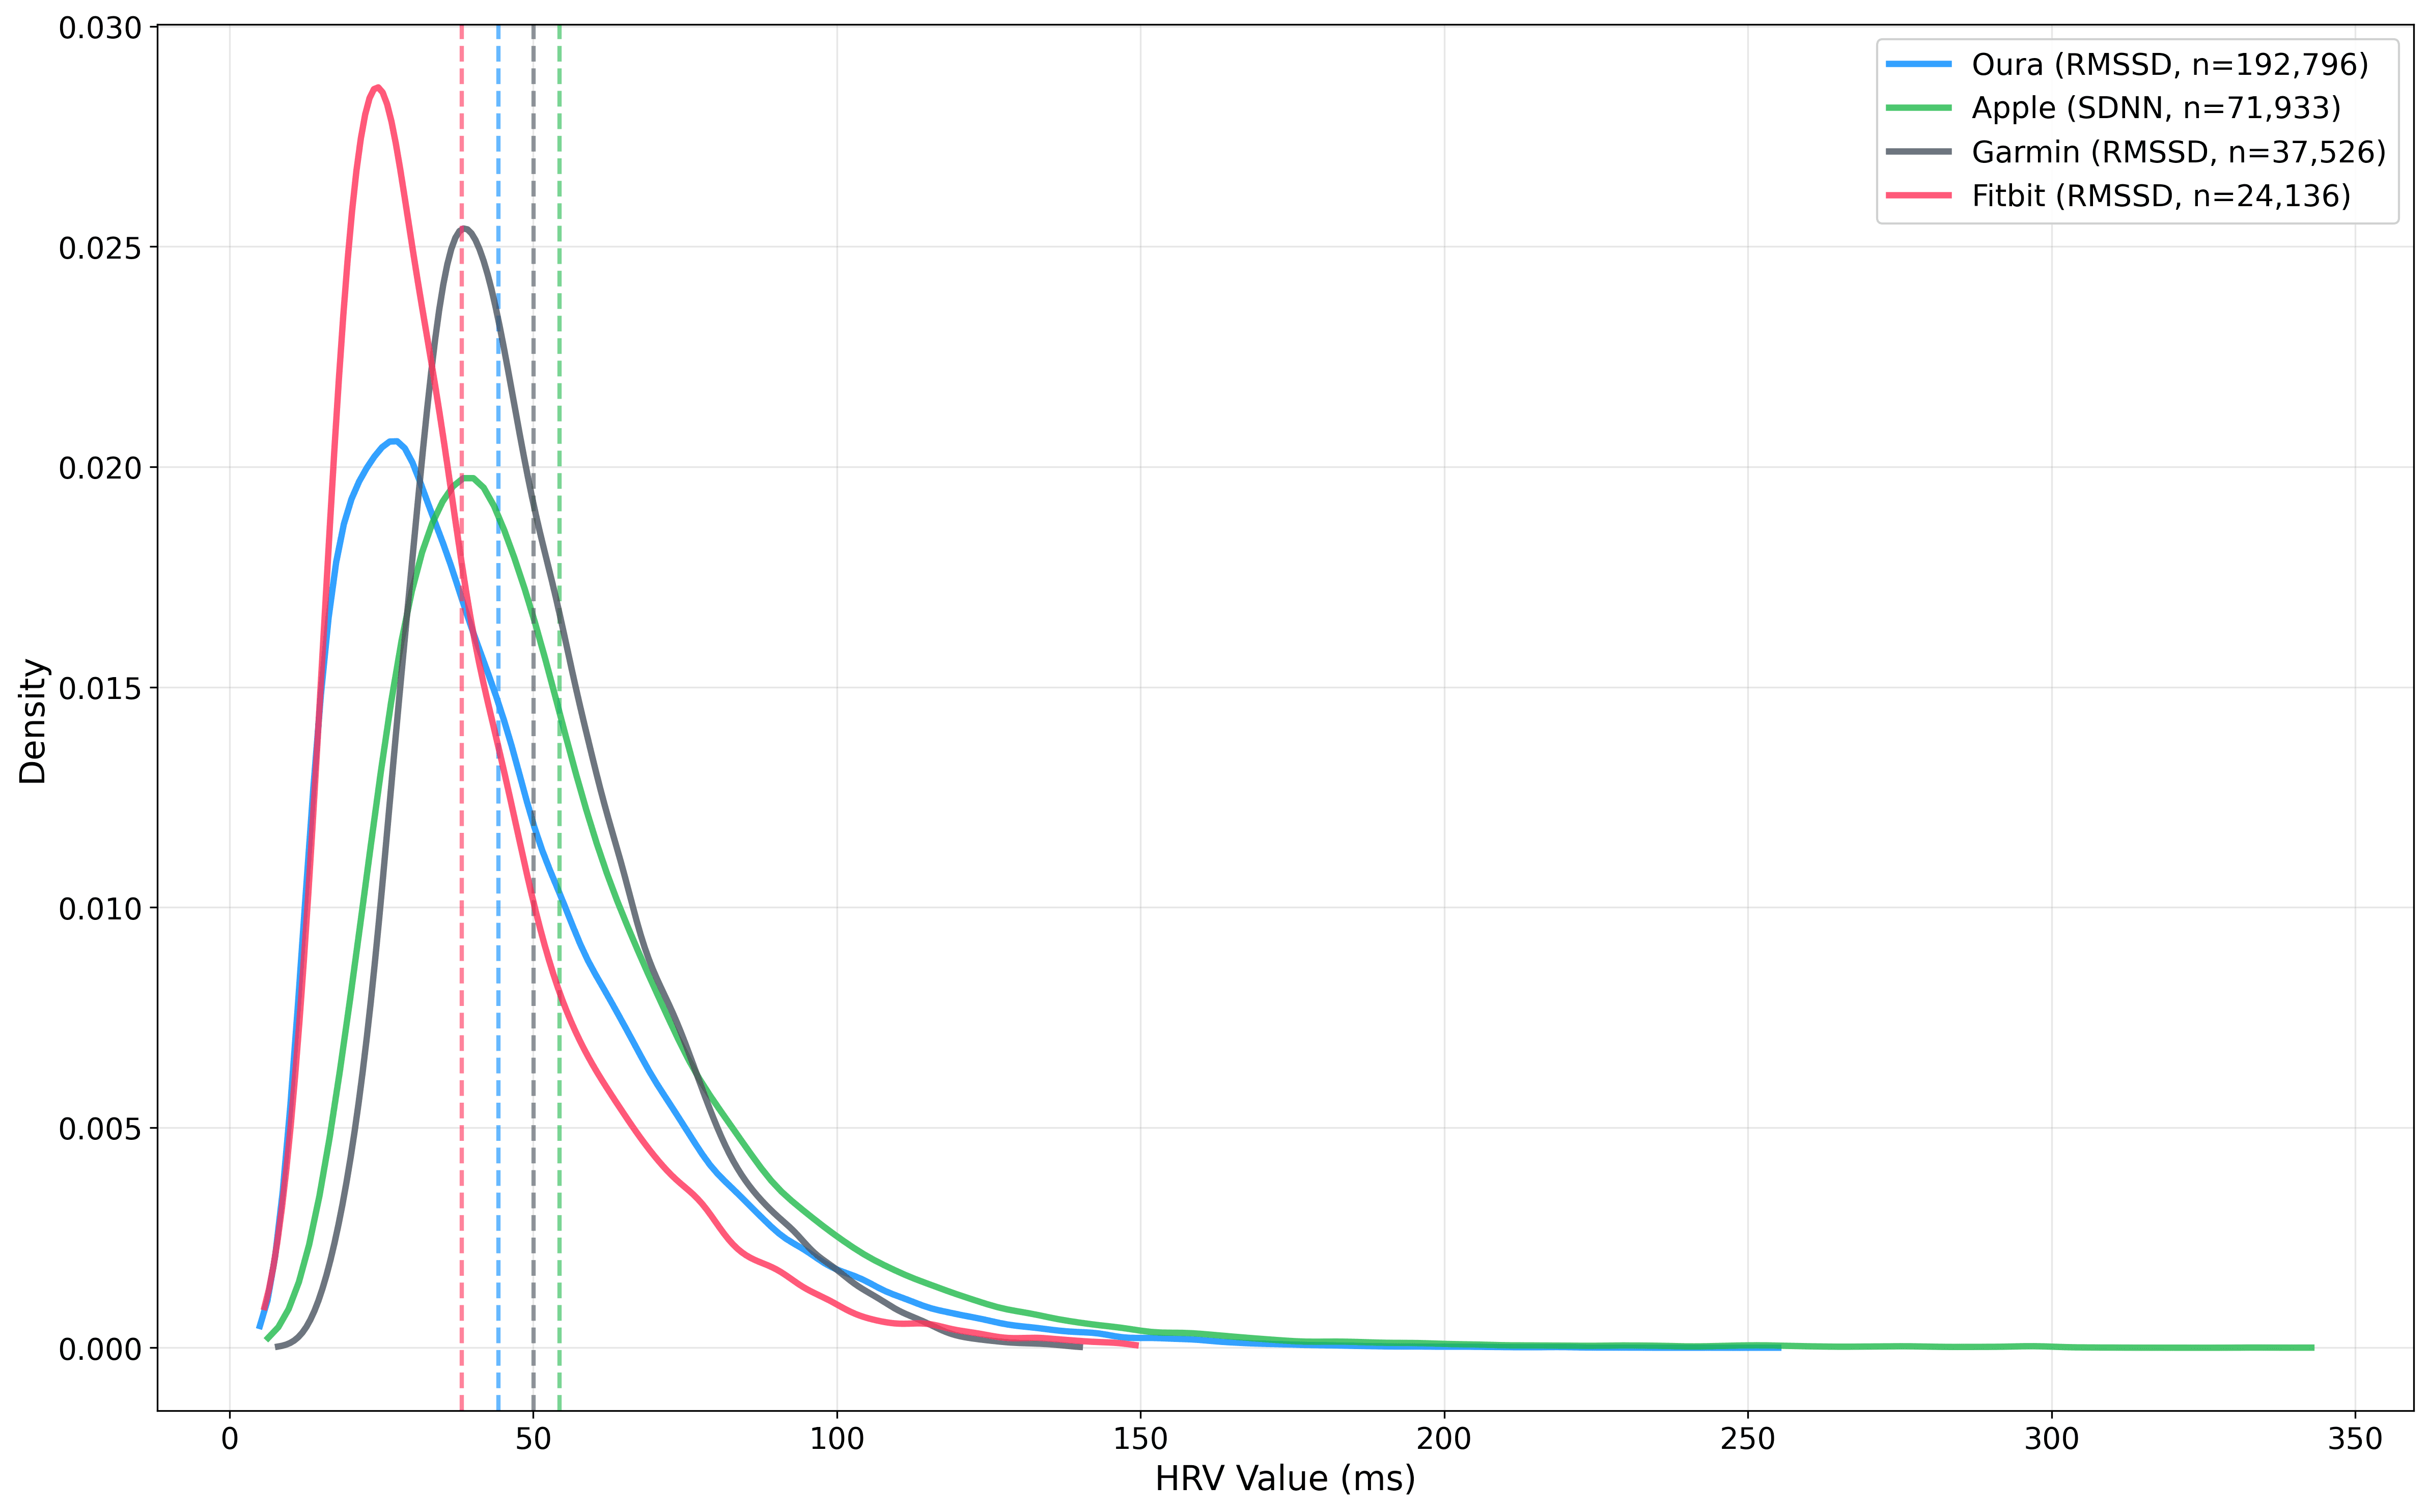
Figure 1: The different distributions of all the HRV data from each variable across the period. We can see that HRV usually hangs around 50ms, before gradually falling off. The differences in deviations are looked into in further detail below.
Get the latest Terra Research reports and insights every week as soon as they're published.
Oura, Garmin and Fitbit report HRV via RMSSD (a measure of short-term parasympathetic activity), while Apple uses SDNN (a broader measure of overall variability) [2].
Oura (RMSSD): Mean HRV of 44.7 ms with high daily variation and hints of seasonal patterns.
Apple (SDNN): The highest mean (54.5 ms) but also the widest spread, producing more extreme outliers and noisier trends. We can't directly compare SDNN to RMSSD, so it's included here for interest.
Garmin (RMSSD): Stable and less variable (mean 50.4 ms), with consistent daily trends.
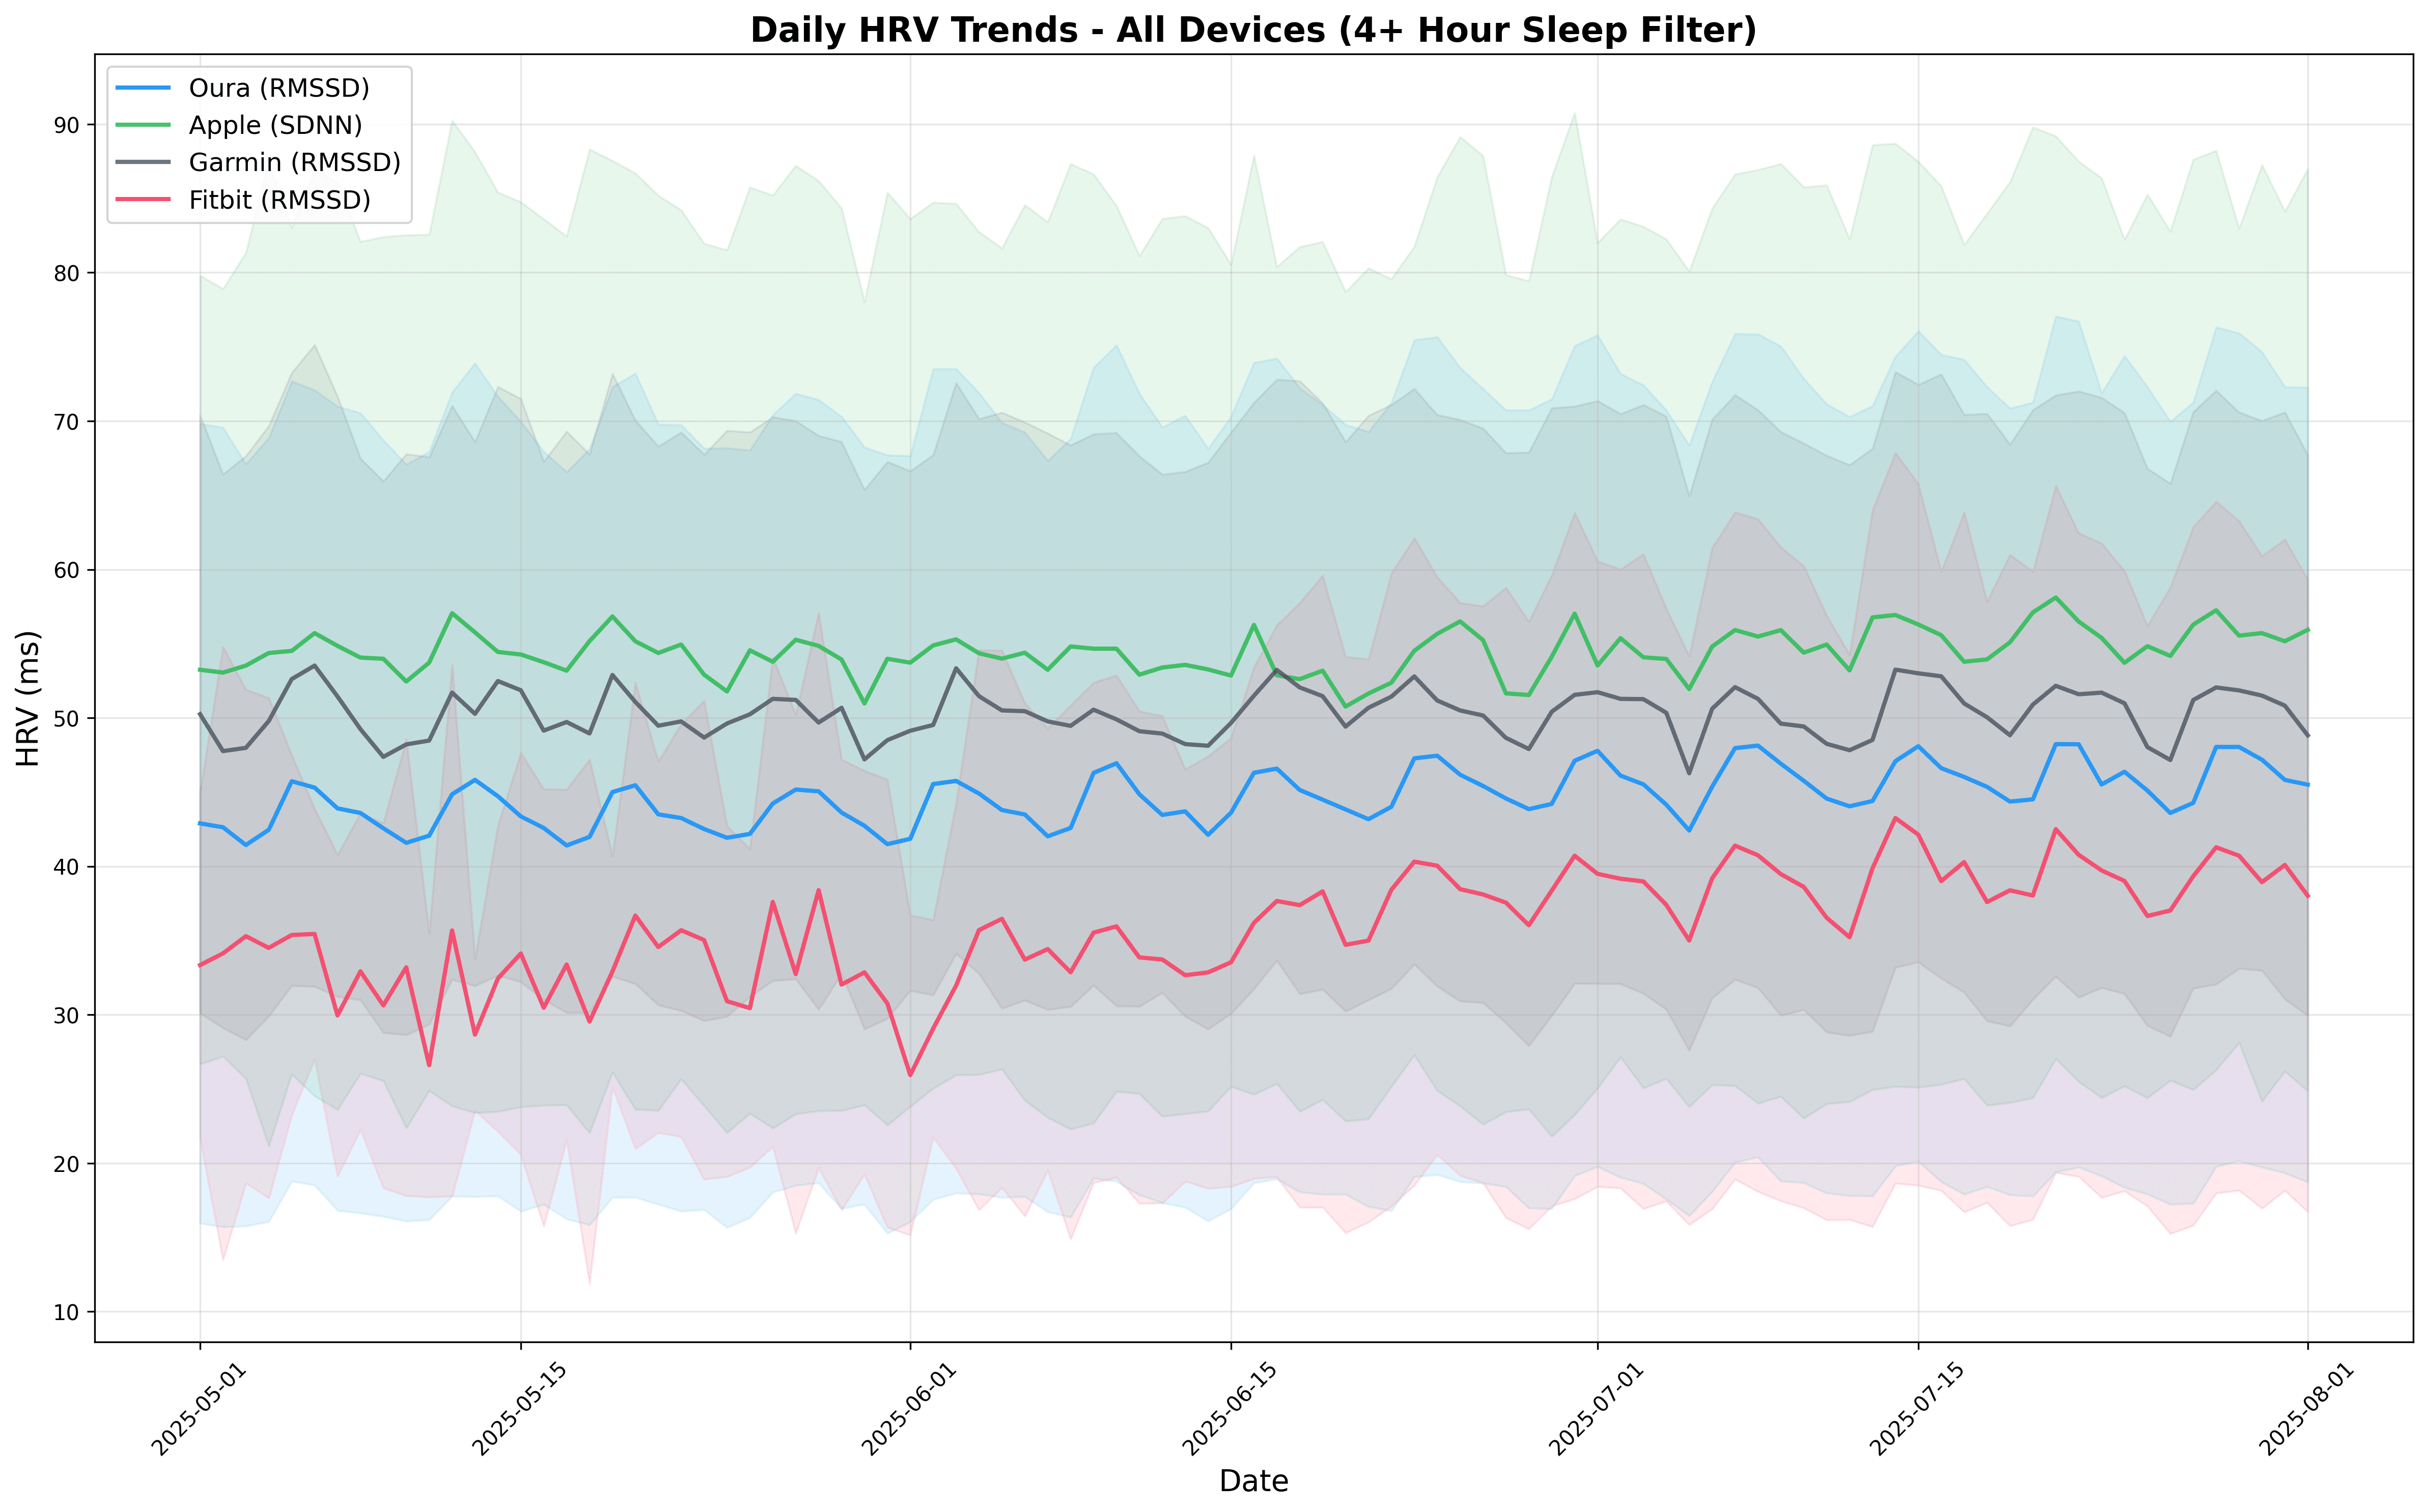
Looking at the combined 93-day daily trends, Oura shows strong cyclic patterns that may reflect lifestyle and seasonality, while Garmin stays steady with low variability. Apple produces smoother curves but at the cost of greater scatter, particularly at higher heart rates. Fitbit, on the other hand, captures the ups and downs but tends towards lower absolute HRV values.
Figure 2: The populations HRV trend over the three months. You can see the weekly and general (seasonal trend). Ignore Fitbit’s “shaky” start, this is because they had few users for the first few weeks.
What's Different About Apple’s SDNN?
RMSSD and SDNN are both time-domain measures of heart rate variability (HRV), but they differ in what they capture about the fluctuations in time intervals between heartbeats. I thought this provided a great opportunity to remind myself of what each metric tells us, how the data differ in the real world, and how both metrics compare to HR. Bear with me!
SDNN, or the standard deviation of all normal-to-normal (NN) intervals, provides a broad assessment of overall HRV over a given period, incorporating both short-term and long-term influences such as sympathetic and parasympathetic nervous system activity, circadian rhythms, and external stressors. It's ideal for longer recordings, such as 24-hour monitoring, as it captures the total variance in heartbeat intervals, providing a comprehensive indicator of autonomic nervous system balance and overall cardiovascular adaptability.
RMSSD, the root mean square of successive differences between adjacent NN intervals, focuses specifically on short-term, beat-to-beat variability, which is predominantly driven by parasympathetic (vagal) activity. This makes RMSSD more sensitive to rapid changes, like respiration or acute stress, and ideal for shorter measurements where it offers a purer signal of vagal tone. Most wearables measuring RMSSD take a mean of several five-minute recording sessions from the same night. I've recently been trialling a Withings device, which takes a novel approach by reporting different HRV data for the first and last 90 minutes of sleep.
Both RMSSD and SDNN exhibit negative correlations with heart rate (HR), meaning higher HR is typically associated with lower HRV values in these metrics, due to the inverse relationship between autonomic activation and heartbeat variability. Elevated HR often signals sympathetic dominance, which reduces variability by enforcing a more rigid rhythm, while lower HR aligns with parasympathetic predominance, enhancing fluctuations. There is also a (probably less interesting) mathematical component to the correlation: the faster the heart rate, the shorter the intervals are and the less "room" there is for variation in the intervals.
The stronger correlation with RMSSD we see in this data (-0.577 for Oura and -0.505 for Fitbit) is expected because RMSSD is more directly linked to parasympathetic modulation, which has a pronounced inverse effect on HR. SDNN (-0.377 for Apple) is more holistic, but it can be diluted by confounding factors such as long-term cycles or artefacts, leading to weaker or less consistent correlations. Studies confirm this pattern, showing RMSSD's closer tie to vagal influences results in more robust negative associations with HR.
A couple of other (incidental) findings:
Variability at higher HR – Apple’s coefficient of variation (CV) increases with heart rate (up to 62%), while Oura’s decreases.
More outliers – Apple produced four times as many extreme HRV values (>200 ms) as Oura, suggesting either measurement noise or a different population effect.
Oura vs Fitbit: A Closer Look
When comparing Oura and Fitbit directly, the differences are both statistically and clinically meaningful:
HRV: Oura averages 9.3 ms higher than Fitbit (p < 0.001).
Correlation strength: Oura’s HRV–HR link is 22% stronger than Fitbit’s.
It would be easy to draw quick conclusions from this and criticise our Fitbit-using friends, and declare that they are a little less aerobically healthy than Oura users. However, it's probably mainly due to technical device differences, such as sensor technology, device placement, and data processing, as well. Oura's finger-based sensors provide superior blood flow stability and fewer motion artefacts. Validation studies confirm Oura's alignment with ECG gold standards [3], making these biases significant (p < 0.001) and impactful for recovery tracking, as Fitbit may overestimate stress via inflated RHR. Additionally, Oura's 22% stronger HRV-HR correlation probably stems from its comprehensive five-minute epoch averaging for RMSSD, enhancing detection of parasympathetic activity, while Fitbit's intermittent sampling introduces variability and weaker links.
What This Means for Users and Researchers
For the everyday user:
Oura’s RMSSD gives a strong signal of recovery and is tightly linked to heart rate.
Fitbit provides similar information but tends to read lower, which may affect day-to-day comparisons.
Apple’s SDNN should be interpreted differently—it’s not “worse”, but it reflects broader autonomic balance rather than short-term parasympathetic activity.
Garmin’s stable readings suggest a reliable, if somewhat conservative, signal.
For researchers:
Don't compare across devices. And definitely don't compare RMSSD and SDNN!
Consider device-specific biases and outlier rates when designing studies.
Apple’s SDNN data may offer unique insights into overall autonomic tone, but it’s less useful for fine-grained, heart-rate–linked recovery analysis.
[1] Malik, Marek, and A. John Camm. "Heart rate variability." Clinical cardiology 13.8 (1990): 570-576.
[2] Shaffer, Fred, and Jay P. Ginsberg. "An overview of heart rate variability metrics and norms." Frontiers in public health 5 (2017): 258.
[3] Dial, Michael B., et al. "Validation of nocturnal resting heart rate and heart rate variability in consumer wearables." Physiological Reports 13.16 (2025): e70527.
Summary questions
Why is my HRV different on Apple versus Oura or Garmin?
Because Apple reports SDNN while Oura, Garmin, and Fitbit report RMSSD — two fundamentally different metrics. SDNN captures overall variability including long-term influences and circadian rhythms, while RMSSD isolates short-term, beat-to-beat parasympathetic activity. In our 93-day analysis, Apple averaged 54.5 ms (SDNN) versus Oura's 44.7 ms and Fitbit's 38.7 ms (RMSSD), but these numbers aren't directly comparable.
Which wearable gives the most stable HRV readings?
Garmin, by a clear margin. Across the 93-day period, Garmin posted a mean RMSSD of 50.4 ms with a standard deviation of just 19.4 ms — the tightest spread of any device tested. Apple was the noisiest, with an SD of 30.2 ms and a range stretching from 0.4 to 342.8 ms.
Is Fitbit underestimating my HRV?
Likely yes, relative to finger-based sensors. Oura averaged 9.3 ms higher HRV and nearly 5 bpm lower resting heart rate than Fitbit (both p < 0.001). The gap is largely technical — Oura's finger placement gives more stable blood flow and fewer motion artefacts, plus its five-minute epoch averaging detects parasympathetic activity more reliably than Fitbit's intermittent sampling.
Should I compare HRV numbers between two different wearables?
No. Devices differ in sensor placement, sampling windows, outlier handling, and even which metric they report. Apple produced four times as many extreme HRV values above 200 ms as Oura, and Oura's HRV–HR correlation is 22% stronger than Fitbit's. Pick one device and track trends within it — cross-device comparisons aren't meaningful.
Why does my HRV drop when my heart rate is higher?
It's both physiological and mathematical. Higher HR usually reflects sympathetic dominance, which enforces a more rigid rhythm and reduces variability, while lower HR allows parasympathetic fluctuations to show. There's also less mathematical "room" for variation when intervals are shorter. The data confirms this: RMSSD correlated -0.577 with HR on Oura and -0.505 on Fitbit, while Apple's SDNN showed a weaker -0.377.
Does RMSSD or SDNN tell me more about recovery?
RMSSD is the better recovery signal. It isolates parasympathetic (vagal) activity, which is what drives overnight recovery and responds quickly to stress, sleep, and respiration. SDNN is broader — useful for assessing overall autonomic balance over 24-hour windows, but diluted by long-term cycles and artefacts when you're trying to read morning readiness.
Can wearable HRV actually be trusted against medical-grade measurement?
For some devices, yes. Validation studies have confirmed Oura's nocturnal HRV and resting heart rate align with ECG gold standards. That makes the device-to-device biases observed here clinically meaningful — a Fitbit user seeing inflated RHR and lower HRV may be reading elevated stress that isn't really there, while Oura's readings track closer to true autonomic state.
Why does Apple's HRV look so noisy compared to other devices?
Two reasons: the metric and the variability profile. SDNN inherently captures more sources of variation than RMSSD, and Apple's coefficient of variation actually increases with heart rate, reaching up to 62%, while Oura's decreases. Combined with four times more extreme outliers above 200 ms versus Oura, Apple's curves look smoother on average but scatter much more at the individual reading level.